Real User Monitoring for applications

Monitor your customer journey on browser-based applications. Track every request, detect page load slowness, identify slow URLs, diagnose if slowness is due to network, client, server or content, and ensure superior user experience.

Free Trial

Trusted by leading companies

Monitoring
digital user experience

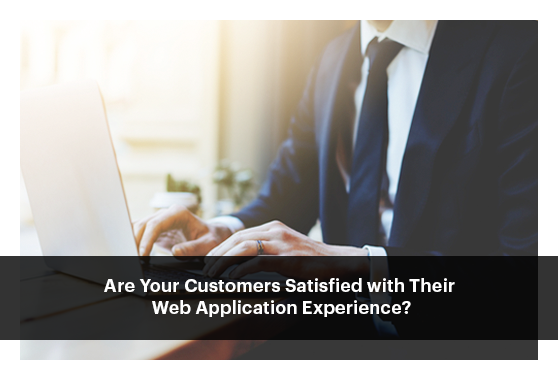
For business applications to be successful, enterprises must ensure that customers get a great digital experience, every time. Insights into the performance and stability of websites and web applications are essential to retain customers and grow your business.

Traditional data center-centric views of IT performance do not provide the complete picture of actual user experience. While these can provide high-level uptime/downtime analytics, they lack actionable insights of real user experience and service slowdown, a critical need for IT managers to preemptively detect and resolve issues.

RUM Monitoring with eG Enterprise

Real User Monitoring
with eG Enterprise

Real User Monitoring - RUM

eG Enterprise provides complete visibility into the real user experience by monitoring every user, anytime, from anywhere, on any browser, from any device. Using an agentless approach, eG Enterprise passively and continuously monitors end-user experience in real time.

  • Get insights into user experience, application performance and user activity analytics—all from a single, intuitive web-based console.
  • Troubleshoot user experience issues with real-time visibility into website performance and errors, and fast insights into the actual cause of slowdowns.
  • Monitor the real user experience of enterprise applications such as Microsoft Dynamics, SharePoint, Office 365, Atlassian Confluence, and PeopleSoft, and custom web applications built on Java, .NET, Ruby on Rails, Python and PHP.

We have no more frustrations because now we know where the problem is, and the root cause of issues is detected in minutes. With the eG Enterprise performance monitoring suite we deliver a robust and reliable environment that guarantees maximum uptime and user satisfaction.

Wilfried Landsheer Director, Systemat Digital Hub

Features

Monitor global user experience in real time with geo dashboard

  • Monitor end-user experience in real time, and view performance metrics by geographic location (country, region, and city)
  • Pinpoint which locations’ users are impacted by poor application performance
  • Easily drill down into a location to find out why user experience is poor
  • Get alerted to user experience problems preemptively with the help of intelligent alerts
  • Self-learning dynamic baseline thresholds make alerting accurate and reduce false positives

Measure user satisfaction levels and take preemptive action

  • Monitor page load times and proactively get alerted to slowdowns, JavaScript errors, and downtime
  • Application owners and IT managers can visually track the overall level of user satisfaction
  • Use the industry standard Apdex score as a simplified SLA for tracking user satisfaction
  • Combine business metrics and real user monitoring to understand how slow performance is affecting your business
Real User Experience Monitoring with eG Enterprise

Troubleshoot faster with root cause analysis

eG Enterprise dissects the processing time of web transactions and identifies what is causing slowdown.

  • Triage problems faster by knowing whether the slowdown is due to the network, server, front-end browser processing, or content download
  • Identify slowdown due to DOM download, high DNS lookup time or TCP connection time
  • View the breakdown of all page resources to gauge the impact of JavaScript, CSS, and images, as well as third-party content such as ads, social, and analytics
  • Intuitive web interface provides visualization tools to easily analyze slow transactions and detect issues
Digital Experience Monitoring with eG Enterprise

Analyze and optimize user experience

Leverage out-of-the-box analytics, reports and trend graphs to answer key performance questions, such as:

  • What are the top 5 poorly performing page groups?
  • Where is most of the traffic coming from—which city, country, browser, device type (mobile/desktop/tablet)?
  • Geo performance: Are certain locations slower versus others?
  • Are my users satisfied, tolerating or frustrated?
  • Did a site slowdown coincide with a peak in traffic?
  • Which page types are most impacted and performing poorly: base page, Ajax, iframe?
RUM Monitoring Tools: eG Enterprise

Supported platforms
and technologies

Web Applications Supported Platforms & Technologies
Packaged Applications Microsoft Dynamics, Microsoft SharePoint, Microsoft Office 365, Atlassian Confluence, SAP Fiori, Oracle PeopleSoft
Custom Applications Java, .NET, Ruby on Rails, Python Django, CakePHP, Drupal


Start your free trial or schedule a custom demo with an engineer

  • Works on cloud environments, hybrid cloud setups and on-premises deployments
  • Deploy eG Enterprise using our SaaS platform or on-premises
  • Suitable for monitoring cloud applications, digital workspaces and IT infrastructures
Please Enter Valid Work Email
eG Enterprise