 Digital Performance Monitoring
Performance monitoring in today’s all-digital world is not a luxury; it’s a necessity. Whether the data center is running on-premises or workloads are hosted in the cloud, IT operations teams must incorporate monitoring into service delivery and enablement. Monitoring is an early warning system that alerts IT operations when something has gone wrong or is about to go wrong: e.g., application slowness, downtime and outages, configuration changes, capacity issues, and so on.
There is a plethora of monitoring tools in the market today. Some are built-into the vendor’s solutions themselves (e.g., VMware vCenter, Citrix Director). Some are focused on a specific tier of the IT environment – e.g., database monitoring, network monitoring, virtualization monitoring and so on. There are others that cover the entire IT landscape and provide visibility end to end. Finally, there are also solutions that function as a manager of managers – i.e., they do not collect metrics directly but aggregate them from other monitoring tools and analyze them to provide alerts, diagnosis and insights.
What is the best approach to choose and implement a monitoring solution? Almost everyone agrees that end-to-end visibility is a must, so there are no blind spots in the infrastructure. To get this single pane of glass, should you adopt an integrated or a converged monitoring strategy? Let’s reflect on both these approaches in more detail.
Integrated Monitoring: The Problem of Fragmentation, Silos and Many Datasets
 Integrated monitoring provides a single pane of glass by combining toolsets. Even where one vendor’s solutions are concerned, this may involve a loose coupling of products. Dashboards can be created with each panel providing visibility into different tiers of the infrastructure. Even though the displayed data resides in the same database, there is no correlation or analysis of the data to unearth insights. Many times, the visual representation across tiers is also different, which adds to the learning curve and reduces usability.
Integrated monitoring still provides a fragmented approach to monitoring. On the other hand, users do not perceive or use digital business services silo by silo. For example, Microsoft Exchange and Active Directory may be hosted on two different servers in the data center, but the email service delivered to end users is a singular function. When email is slow, the user complaint will only address the email slowness and not the Exchange or Active Directory performance bottlenecks.
Another complication is the fact that there are many interdependencies between tiers supporting a digital business service. Taking the same email example, a slowness in Active Directory will reflect as a slowdown in processing on the Exchange server. If the infrastructure is monitored tier by tier, manual intervention and analysis is required to determine the root-cause of the problem. This is one reason why war room meetings and lengthy problem resolution times are common in organizations that employ an integrated monitoring approach.
 Over 35% IT pros feel that because they have too many monitoring tools and dashboards, they are slower at responding to critical issues and identifying the root cause.
Opsview Survey, 2016
While monitoring integration can force things to ‘fit’ into a whole, convergence is what really provides uniformity and coherence.
How Converged Monitoring Provides Contextual Clarity
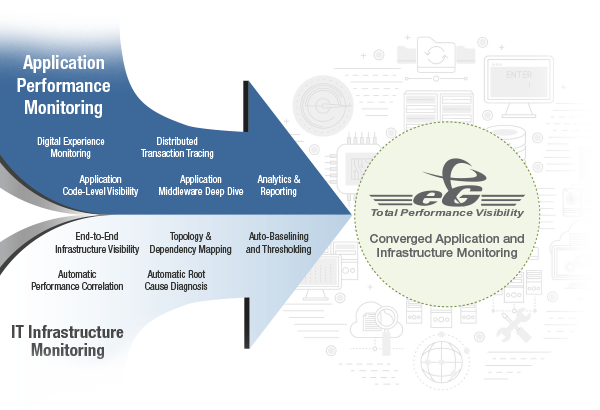
 In a converged monitoring strategy, intelligence is pre-built into the monitoring tool to understand dependencies and interactions between different IT components. As opposed to dealing with unrelated alerts from different tools and overlapping/duplicate alerts from integrated toolsets, a converged monitoring solution brings machine learning and automatic correlation into the mix to process all the KPIs collected across different sources, understands how one alert is related to another, leans the impact of one component on another, and differentiates the problem from incidents and the root cause from its effects.
This provides clarity for action. As opposed to independently knowing there’s a problem in different tiers, you can get alerted to the business impact – which is knowing when there’s application failure/slowdown and the exact root cause. This method of converged and correlated monitoring improves empirical effectiveness and alerting accuracy and accelerates problem triage and troubleshooting.
A converged monitoring solution also addresses the needs of different stakeholders in an organization. Service managers can see not only the overall health of their services but also the state of the different tiers that are responsible for supporting the service. Experts administering and monitoring the individual domains can still get segmented views, so they can focus just on the parts of the infrastructure that they are responsible for. The service desk/helpdesk also benefits from this approach. While they do not need deep-dive visibility into each tier, they get correlated color cues that can help them triage problems quickly and just involve the relevant domain experts in resolving a problem. Capacity planners too can get holistic insights across every layer and every tier of the infrastructure.
4 Things to Look For In A Converged Monitoring Solution |
|---|
|
 Implementation simplicity: Just deploy one solution, one agent, one platform that works with heterogeneous infrastructures and application frameworks.
Try eG Enterprise, a fully converged application and infrastructure monitoring solution, that allows you to monitor your entire IT environment from a single pane of glass. With built-in correlative intelligence and AIOps, eG Enterprise helps isolate the root cause of problems quickly, serving as your single source of truth for digital performance management and IT troubleshooting.
eG Enterprise is an Observability solution for Modern IT. Monitor digital workspaces,
web applications, SaaS services, cloud and containers from a single pane of glass.