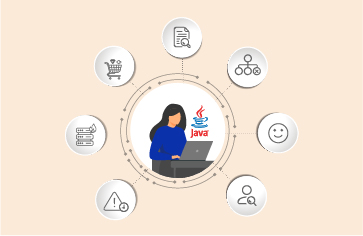
What is a Thread in Java?
A thread in Java is the path followed when executing a program. All Java programs have at least one thread, known as the main thread, which is created by the Java Virtual Machine (JVM) at the program’s start, when the main() method is invoked.
In Java, creating a thread is accomplished by implementing an interface and extending a class. Every thread in Java is created and controlled by the java.lang.Thread class.
A single-threaded application has only one Java thread and can handle only one task at a time. To handle multiple tasks in parallel, multi-threading is used: multiple Java threads are created, each performing a different task.
Java Thread vs. Java Process: What is the Difference?
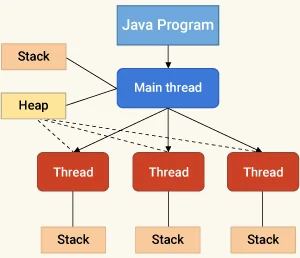
have their own stack but share the heap memory
of the JVM.
A question that often comes up is how is a Java thread different from a Java process.
- A Java process is a program in execution. A Java thread is a subset of a Java process.
- A Java process consists of multiple threads and a Java thread is often regarded as a light-weight process.
- While a Java process has its own address space, a Java thread uses the process’ address space and shares it with other threads of that process.
- A thread can communicate with other threads of the same process using methods like wait(), notify(), notifyAll(). Global variables can also be used to pass data between threads. On the other hand, a process can only communicate with other process by using inter-process communication techniques like sockets, files, etc.

Why are Multiple Threads used in Java Applications?
Most commercial Java applications use multi-threading extensively. This is done for several reasons, explained in the multi-thread examples below:
- For faster processing of background/batch tasks: When multiple tasks must be performed simultaneously, multi-threading allows the different tasks to proceed in parallel. The overall processing time is reduced as a result.
- To take advantage of modern processors: Most modern systems have multiple processors and each processor has multiple cores. Multi-threading allows different threads to be run by different processors, thereby allowing the system resources to be more efficiently used.
- For reducing response times: Users expect Java applications to be fast. By breaking the processing needed for a request into smaller chunks and having different threads handle the processing in parallel, response time can be reduced.
- To serve multiple users at the same time: Java application servers like Tomcat, JBoss, Oracle WebLogic and IBM WebSphere are expected to support thousands of users in parallel. Multi-threading is the only way this can be achieved. One Java thread is spawned by the application server for each request to be handled.


Why Should You Monitor Java Threads?
Java applications in production can have hundreds or thousands of Java threads running in parallel. When an issue is detected – e.g., the JVM is taking up very high CPU resources – an obvious question is which Java thread is causing the CPU spike? And an immediate next question is which code snippet is the Java thread executing?
While it is important to report this information in real-time, it is also important that these details are made available for historical analysis. For instance, your application could have had a CPU spike at 2 am and become unresponsive, forcing your operations team to restart the server. While this would have solved the problem temporarily, what was the cause (which thread, or method or line of code) and how do we prevent this issue from re-occurring?
Having the details of what threads in the JVM were running at 2 am and which Java thread was taking up CPU is a key to being able to diagnose the application performance issue.
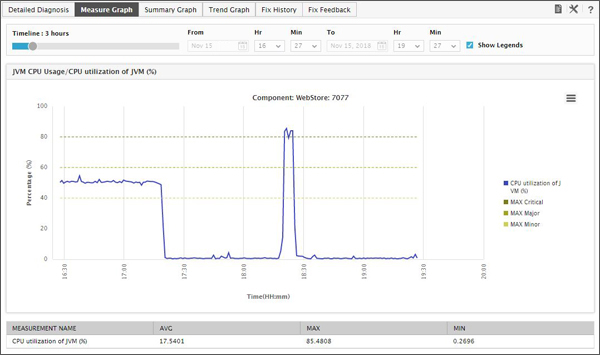
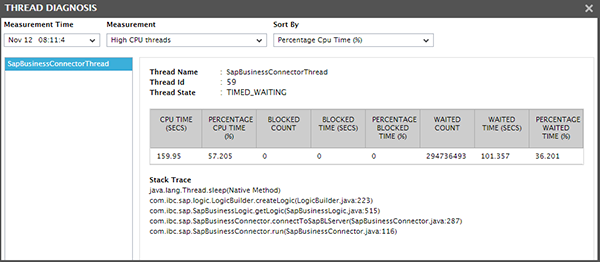
The screenshots below show how eG Enterprise captures the historical data of metrics like high CPU usage in Java applications so you can see trends over time, and also dive into the JVM stack trace for further analysis.
Synchronization of Threads Can Also Affect Java Application Performance
Multiple threads in a JVM can be performing similar tasks. For instance, a configuration file may need to be updated when a request is processed. Since multiple threads access the same configuration file, it is essential to synchronize the threads, so only one thread at any time can be updating the configuration file.
While synchronization ensures consistency of the common resource (in this case, the configuration file), it also introduces the possibility of delays in processing requests. Requests being processed by an application server must wait until the corresponding thread is allowed to enter the synchronized block. Excessive use of synchronized blocks can result in a high percentage of the processing time of a request being spent waiting for access to synchronized blocks of code.
To ensure a great user experience for your Java application, it is important to ensure that blocking due to thread synchronization is kept to a minimum.
At the same time, it is also important to track the number of threads being spawned in the JVM. If too many threads are created in parallel, the JVM memory must be sufficiently sized to handle this load. If not, application performance will suffer.
How many Java threads can be executed at a time? As many as the JVM memory can handle! You can use a JVM monitoring tool like eG Enterprise to keep track of JVM memory usage and use those insights to know how many Java threads your application can comfortably execute at a time.
Administrators must also track cases of thread leaks – i.e., instances when the number of threads in the JVM keep on increasing and ultimately cause the JVM to crash.
Application servers have Java thread pools where threads are created and remain in a waiting state for new user requests. The thread pools have maximum limits on the number of threads in each pool. If this limit on the maximum number of threads that can be executed in a pool is reached, new requests to the application server will be rejected, which is why it is important to monitor the number of current threads in each pool.

Monitoring Java Threads: Key Questions to Answer |
|---|

Modern JVMs provide JMX interfaces that allow monitoring tools to track thread activity in the JVM. The key questions you should try to answer with your Java application performance monitoring solution include:
|

eG Enterprise is an Observability solution for Modern IT. Monitor digital workspaces,
web applications, SaaS services, cloud and containers from a single pane of glass.