Citrix Applications Test
This test reports statistics pertaining to the different applications executing on a Citrix Virtual Apps server and their usage by Citrix clients.
Note:
This test will report metrics only if the Virtual Apps server being monitored uses the .Net framework v3.5 (or above).
Target of the test : Citrix Virtual Apps
Agent deploying the test : An internal agent
Outputs of the test : One set of results for each application that is being monitored.
| Parameters | Description |
|---|---|
|
Test Period |
This indicates how often should the test be executed. By default, this is set to 5 minutes. |
|
Host |
The host for which the test is to be configured. |
|
Port |
The port number at which the specified host listens to. By default, this is 1494. |
|
Show Published Apps |
Using this flag, you can indicate whether the test should monitor published applications alone or all applications running on the server. By default, this flag is set to No, indicating that all applications will be monitored by default. To monitor only published applications, you need to set this flag to Yes. However, prior to changing the flag status to ‘Yes’, you need to make sure that a ‘Citrix XenDesktop Broker’ componexnt is also managed by the eG Enterprise system and is reporting metrics. |
|
Show Published Desktops |
By default, this flag is set to No. If this flag is set to Yes, then the detailed diagnosis of this test will list the resource-intensive processes/applications accessed by a user along with the exact published desktop that has been used by the user to access the application. Note that, in the detailed diagnosis, the ‘host name’ of the monitored server will be displayed as the ‘published desktop name’. |
|
Report By Domain name |
By default, this flag is set to Yes. This implies that by default, the detailed diagnosis of this test will display the domainname\username of each user who accessed an application on the server. This way, administrators will be able to quickly determine which user logged into the server from which domain. If you want the detailed diagnosis to display only the username of these users, set this flag to No. |
|
Enable Browser Monitoring |
By default, this flag is set to No, indicating that the eG agent does not monitor browser activity on the Virtual Apps server. If this flag is set to Yes, then, whenever one/more IE (Internet Explorer) browser instances on the Virtual Apps server are accessed, the detailed diagnosis of the Instances currently running measure will additionally reveal the URL being accessed via each IE instance and the resources consumed by every URL. Armed with this information, administrators can identify the web sites that are responsible for excessive resource usage by an IE instance. |
|
Combined IE Report |
This flag is applicable only if the Show Published Apps flag is set to Yes. Typically, the detailed diagnosis of this test lists the applications that a user accessed on the Virtual Apps server and the resource usage of each application. To fetch these details, the eG agent takes the published name (eg., Word) of each application that is open on the Virtual Apps server, determines the underlying process and process arguments that drive the application (eg., winword.exe is the process that drives Word), and tries to find an exact match for this process name and arguments in the task manager. If an exact match is found, then, by default, the underlying process name of the application is displayed in the detailed diagnosis. The resource usage metrics that correspond to that process name in the task manager are also displayed as part of detailed diagnosis. For published applications that open in the Internet Explorer (IE) browser on Virtual Apps, this process name matching algorithm may not work. This is because, if multiple applications on Virtual Apps are opened using IE, each such application will open only in a different tab page of the IE browser. As a result, though the underlying process names will be different for each of these applications, in the task manager, the process names for all these applications will only be 'iexplore.exe'. Because of the name mismatch (between Virtual Apps and the task manager), the eG agent will wrongly determine that no instance of an application is running, and will exclude that application name from the detailed diagnostics. To avoid this, with the Show Published Apps flag set to Yes, set this flag to Yes. If this is done, then, the eG agent will be able to capture every application or application instance that is opened in a different tab page of an IE browser, despite the process name mismatch. Also, the eG agent will be able to collect detailed metrics of such applications and display them in the Detailed Diagnosis page against the process name 'Internet Explorer'. |
|
Exclude |
By default, this parameter is set to none. This means that the test will monitor all the applications that are launched on the Virtual Apps server, by default. If you want the test to disregard certain applications when monitoring, then provide a comma-separated list of process names that correspond to the applications you want to ignore, in the Exclude text box. For instance, your specification can be: winword.exe,js.exe,taskmgr.exe. Your specification can include wild card patterns as well. For example: *win*,js*,*task |
|
Show All Desktop Processes |
Using this flag, you can indicate whether the test should report top resource-intensive processes alone or all processes running in the background when the user accesses an application. By default, this flag is set to No, indicating that this test will report only top three resource-intensive processes e.g. CPU, Memory and IO Reads processes from the desktop OS processes. This helps the administrator optimize the database. To report all the processes, you need to set this flag to Yes. |
|
Show Only Active Apps |
Using this flag, you can indicate whether the test should monitor all applications or applications that are currently active on the server. By default, this flag is set to Yes, indicating that only the currently active applications will be monitored by the eG agent. To monitor all applications, you need to set this flag to No. |
|
Show Only Whitelist Apps |
In some highly secure virtual environments, administrators whitelist an index of business-critical and most commonly used applications that are permitted to be present and active on the target Virtual Apps server. The goal of whitelisting is to protect the target server from potentially harmful applications and prevent any unauthorized files from executing. Application whitelisting places control over which applications are permitted to run on the target server and is controlled by the administrators, rather than the end-user. In such environments, administrators may wish to monitor only the applications that are whitelisted on the target server. To achieve this, administrators can set the Show Only Whitelist Apps flag to Yes. By default, this flag is set to No indicating that this test monitors all applications executing on the target server. By default, eG Enterprise offers a comma separated list of pre-defined applications specified against the WhiteListProcesses option in the [EXCLUDE_APPLICATIONS] section of the eg_tests.ini file available in the <eG_INSTALL_DIR>/manager/config folder. Setting the Show Only Whitelist Apps flag to Yes will enable this test to monitor only the applications that are listed against the WhiteListProcesses option. If administrators wish to add or remove one or more applications to/from this pre-defined list, then, they can do so by specifying the applications against the WhiteListProcesses option. |
|
DD Frequency |
Refers to the frequency with which detailed diagnosis measures are to be generated for this test. The default is 1:1. This indicates that, by default, detailed measures will be generated every time this test runs, and also every time the test detects a problem. You can modify this frequency, if you so desire. Also, if you intend to disable the detailed diagnosis capability for this test, you can do so by specifying none against DD frequency. |
|
Detailed Diagnosis |
To make diagnosis more efficient and accurate, the eG Enterprise embeds an optional detailed diagnostic capability. With this capability, the eG agents can be configured to run detailed, more elaborate tests as and when specific problems are detected. To enable the detailed diagnosis capability of this test for a particular server, choose the On option. To disable the capability, click on the Off option. The option to selectively enable/disable the detailed diagnosis capability will be available only if the following conditions are fulfilled:
|
| Measurement | Description | Measurement Unit | Interpretation |
|---|---|---|---|
|
Instances currently running |
Number of instances of the published application currently executing on this Citrix Virtual Apps server. |
Number |
This value indicates if too many or too few instances corresponding to an application are executing on the host. Use the Detailed diagnosis of this measure to identify all the users executing this application and comparing the users will help you to identify which user is utilizing the maximum memory, CPU etc |
|
CPU usage |
Indicates the percentage of CPU used by the published application. |
Percent |
A very high value could indicate that the specified application is consuming excessive CPU resources. |
|
Memory usage |
This value represents the ratio of the resident set size of the memory utilized by the application to the physical memory of the host system, expressed as a percentage. |
Percent |
A sudden increase in memory utilization for an application may be indicative of memory leaks in the application. |
|
Handle count |
Indicates the number of handles opened by this application. |
Number |
An increasing trend in this measure is indicative of a memory leak in the application. |
|
Number of threads |
Indicates the number of threads that are used by the application. |
Number |
|
|
I/O data rate |
Indicates the rate at which this application is reading and writing bytes in I/O operations. |
KBytes/Sec |
This value counts all I/O activity generated by each instance of the application and includes file, network and device I/Os. |
|
I/O data operations |
Indicates the rate at which this application is issuing read and write data to file, network and device I/O operations. |
Operations/Sec |
|
|
I/O read data rate |
Indicates the rate at which this application is reading data from file, network and device I/O operations. |
KBytes/Sec |
|
|
I/O write data rate |
Indicates the rate at which this application is writing data to file, network and device I/O operations. |
KBytes/Sec |
|
|
Page fault rate |
Indicates the total rate at which page faults are occurring for the |
Faults/Sec |
This measure is a good indicator of the load on the application. A page fault occurs when a thread refers to a virtual memory page that is not in its working set in main memory. This may not cause the page to be fetched from disk if it is on the standby list and hence already in main memory, or if it is in use by another application with whom the page is shared. |
|
Working set memory |
Indicates the current size of the working set of this application. |
MB |
The Working Set is the set of memory pages touched recently by the threads in a process/application. If free memory in the server is above a threshold, pages are left in the Working Set of an application even if they are not in use. When free memory falls below a threshold, pages are trimmed from Working Sets. If they are needed they will then be soft-faulted back into the Working Set before leaving main memory. Comparing the working set across applications indicates which application is taking up excessive memory. |
|
Input delay for processes - max |
Indicates the maximum amount of time lag detected between the user's input through any input device (e.g., mouse, keyboard) and the time at which this application detected the input. |
Seconds |
Poor application performance is one of the most difficult problems to diagnose by the administrators. Traditionally, diagnosis was done by collecting CPU, memory, disk I/O and a few other metrics. The data collected from traditional metrics were not sufficient to figure out the root cause of poor performance of the applications since the variations measured by the metrics were large. In virtual environments where multiple users accessed an application from remote at the same time, users faced difficulties in accessing the application whenever there was an increase in the count of users. The more the users are accessing the application, the higher was the CPU usage of the systems in the environment and the higher was the user input delays i.e., the users were forced to wait for a longer duration to interact with the application. The user input delay is measured by how long any user input (such as mouse or keyboard usage) stays in the queue before it is picked up by a process. These two measures capture such user input delays at the application/process level. These insights enable administrators to accurately identify which application/process is responding slowly to user requests. These measures will be reported only on Windows 2019 (and above). Ideally, the values of these measures should be 0 or very low. |
|
Input delay for processes - avg |
Indicates the average amount of time lag detected between the user's input through any input device (e.g., mouse, keyboard) and the time at which this application detected the input. |
Seconds |
The detailed diagnosis of the Instances currently running measure, if enabled, lists the user sessions that are currently open, the process ids of the processes being executed by each of the users, and the CPU and memory utilization (in %) of each of these processes. Additionally, this detailed diagnosis helps you in identifying the handles that are opened, the thread count, the read/write operations as well as the I/O operations for each application. This information enables the Citrix administrator to identify the processes with a high CPU/memory utilization. In the event of a server overload, the Citrix administrator might decide to terminate these processes (see Figure 1).
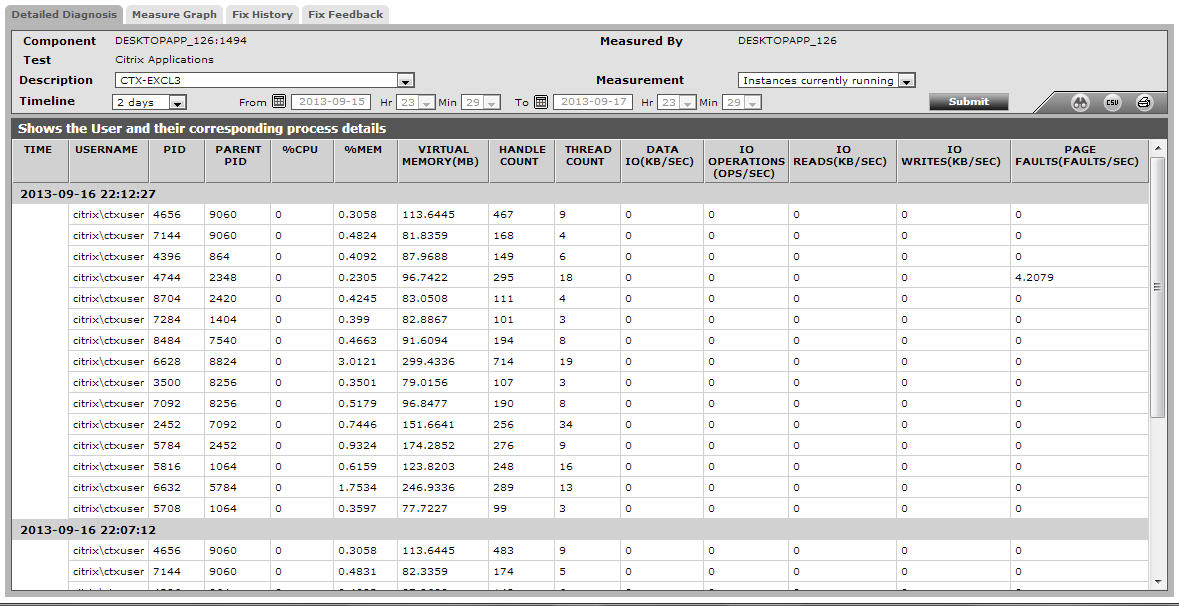
Figure 1 : The detailed diagnosis for the Instances currently running measure
