Windows Services - OS Test
This test tracks the status (whether running or have stopped) of services executing on Windows virtual machines.
Target of the Test: A RHEV Hypervisor
Agent running the test: A remote agent
Output of the test: One set of results for each powered-on guest on the RHEV Hypervisor being monitored.
| Parameter | Description |
|---|---|
|
Test period |
How often should the test be executed. |
|
Host |
The host for which the test is to be configured. |
|
RHEL MGR Host, |
To auto-discover the VMs on a target RHEV hypervisor and obtain the outside view of the performance of each VM, the eG agent needs to connect to the RHEV Manager that manages the target RHEV hypervisor. To enable the eG agent to obtain the outside view, you need to configure the test with the following:
If the RHEV hypervisor being monitored was discovered via an RHEV manager, then the IP address, port number, domain name, and user credentials of the RHEV manager used for discovery will be automatically displayed against the respective parameters. If the RHEV hypervisor being monitored was not discovered via an RHEV manager, but you still want to use an RHEV manager for obtaining the outside view, then, you can select any IP address of your choice from the RHEL MGR host list. By default, this list will be populated with the IP addresses/host names of all the RHEV managers that were configured for the purpose of discovering the RHEV hypervisors. If you select an RHEL MGR host from this list, then the corresponding port number, domain name, and user credentials will be automatically displayed against the respective parameters. On the other hand, if the RHEV manager that you want to use for metrics collection is not available in the RHEL MGR Host list, then, you can configure an RHEV manager on-the-fly by picking the Other option from the RHEL MGR Host list. An ADD THE RHEV MANAGER DETAILS window will then pop up. Refer to Configuring an RHEV Manager to Use for Monitoring the RHEV Hypervisor to know how to add an RHEV manager using this window. Once the RHEV manager is added, its IP address, port number, domain name and user credentials will be displayed against the corresponding parameters. |
|
Confirm Password |
Confirm the RHEL MGR Password by retyping it here. |
|
SSL |
If the RHEV manager to which the eG agent should connect is SSL-enabled, then set this flag to Yes. If not, set it to No. |
|
Ignore VMs Inside View |
Administrators of some high security RHEV environments might not have permissions to internally monitor one/more VMs. The eG agent can be configured to not obtain the 'inside view' of such ‘inaccessible’ VMs using the Ignore VMs Inside View parameter. Against this parameter, you can provide a comma-separated list of VM names, or VM name patterns, for which the inside view need not be obtained. For instance, your ignore VMs inside view specification can be: *xp,*lin*,win*,vista. Here, the * (asterisk) is used to denote leading and trailing spaces (as the case may be). By default, this parameter is set to none indicating that the eG agent obtains the inside view of all VMs on an RHEV host by default. Note: While performing VM discovery, the eG agent will not discover the operating system of the VMs configured in the Ignore VMs Inside View text box. |
|
Exclude VMs |
Administrators of some virtualized environments may not want to monitor some of their less-critical VMs - for instance, VM templates - both from 'outside' and from 'inside'. The eG agent in this case can be configured to completely exclude such VMs from its monitoring purview. To achieve this, provide a comma-separated list of VMs to be excluded from monitoring in the Exclude VMs text box. Instead of VMs, VM name patterns can also be provided here in a comma-separated list. For example, your Exclude VMs specification can be: *xp,*lin*,win*,vista. Here, the * (asterisk) is used to denote leading and trailing spaces (as the case may be). By default, this parameter is set to none indicating that the eG agent obtains the inside and outside views of all VMs on a virtual host by default. By providing a comma-separated list of VMs/VM name patterns in the Exclude VMs text box, you can make sure the eG agent stops collecting 'inside' and 'outside' view metrics for a configured set of VMs. |
|
Ignore WINNT |
By default, the eG agent does not support the inside view for VMs executing on Windows NT operating systems. Accordingly, the Ignore WINNT flag is set to Yes by default. |
|
Inside View Using |
By default, this test communicates with every VM remotely and extracts “inside view” metrics. Therefore, by default, the Inside View Using flag is set to Remote connection to VM (Windows). Typically, to establish this remote connection with Windows VMs in particular, eG Enterprise requires that the eG agent be configured with domain administrator privileges. In high-security environments, where the IT staff might have reservations about exposing the credentials of their domain administrators, this approach to extracting “inside view” metrics might not be preferred. In such environments therefore, eG Enterprise provides administrators the option to deploy a piece of software called the eG VM Agent on every Windows VM; this VM agent allows the eG agent to collect “inside view” metrics from the Windows VMs without domain administrator rights. Refer to Configuring the eG Agent to use the RESTful APIs on the RHEV Manager to Obtain the “Outside View” for more details on the eG VM Agent. To ensure that the “inside view” of Windows VMs is obtained using the eG VM Agent, set the Inside View Using flag to eG VM Agent (Windows). Once this is done, you can set the Domain, Admin User, and Admin Password parameters to none. |
|
Domain, |
By default, this test connects to each virtual guest remotely and attempts to collect “inside view” metrics. In order to obtain a remote connection, the test must be configured with user privileges that allow remote communication with the virtual guests. The first step towards this is to specify the Domain within which the virtual guests reside. The Admin User and Admin Password will change according to the Domain specification. Discussed below are the different values that the Domain parameter can take, and how they impact the Admin User and Admin Password specifications:
|
|
Report By User |
While monitoring a RHEV Hypervisor, the Report By User flag is set to No by default, indicating that by default, the guest operating systems on the hypervisor are identified using the Hostname specified in the operating system. On the other hand, while monitoring a RHEV Hypervisor - VDI, this flag is set to Yes by default; this implies that in case of the VDI model, by default, the desktops will be identified using the login of the user who is accessing them. In other words, in VDI environments, this test will, by default, report measures for every username_on_virtualmachinename. |
|
Report Powered OS |
This flag becomes relevant only if the Report By User flag is set to ‘Yes’. If the Report Powered OS flag is set to Yes (which is the default setting), then this test will report measures for even those VMs that do not have any users logged in currently. Such guests will be identified by their virtualmachine name and not by the username_on_virtualmachinename. On the other hand, if the Report Powered OS flag is set to No, then this test will not report measures for those VMs to which no users are logged in currently. |
|
IgnoreServices |
Provide a comma-separated list of services that need to be ignored while monitoring. When configuring a service name to exclude, make sure that you specify the Display Nameof the service, and not the service Name you see in the Services window on your Windows VM. |
|
DD Frequency |
Refers to the frequency with which detailed diagnosis measures are to be generated for this test. The default is 1:1. This indicates that, by default, detailed measures will be generated every time this test runs, and also every time the test detects a problem. You can modify this frequency, if you so desire. Also, if you intend to disable the detailed diagnosis capability for this test, you can do so by specifying none against DD Frequency. |
|
Detailed Diagnosis |
To make diagnosis more efficient and accurate, the eG Enterprise embeds an optional detailed diagnostic capability. With this capability, the eG agents can be configured to run detailed, more elaborate tests as and when specific problems are detected. To enable the detailed diagnosis capability of this test for a particular server, choose the On option. To disable the capability, click on the Off option. The option to selectively enable/disable the detailed diagnosis capability will be available only if the following conditions are fulfilled:
|
| Measurement | Description | Measurement Unit | Interpretation |
|---|---|---|---|
|
New automatic services started |
Indicates the number of Windows services with startup type as automatic, which were running in the last measurement period. |
Number |
The detailed diagnosis of this measure lists the services (with startup type as automcatic) that are running. |
|
New automatic services stopped |
Indicates the number of Windows services with startup type as automatic, which were not running in the last measurement period. |
Number |
To know which services stopped, use the detailed diagnosis of this measure (if enabled). |
|
New manual services started |
Indicates the number of Windows services with startup type as manual, which were running in the last measurement period. |
Number |
Use the detailed diagnosis of this measure to identify the manual services that are running. |
|
New manual services stopped |
Indicates the number of Windows services with startup type as manual, which stopped running in the last measurement period. |
Number |
To identify the services that stopped, use the detailed diagnosis of this measure. |
As stated earlier, by default, clicking on the Inside View of VMs layer of a managed RHEV Hypervisor, leads you to a page displaying the current status of the virtual guests executing on that server. If you want to override this default setting - i.e., if you prefer to view the tests mapped to the Inside View of VMs layer first, and then proceed to focus on individual guest performance, follow the steps given below:
-
Edit the eg_ui.ini file in the <EG_INSTALL_DIR>\manager\config directory
-
Set the LAYERMODEL_LINK_TO_VIRTUAL flag in the file to false; this is set to true by default.
-
Save the eg_ui.ini file.
Doing so ensures that as soon as the Inside View of VMs layer is clicked, the list of tests mapped to that layer appears, as depicted by Figure 1.
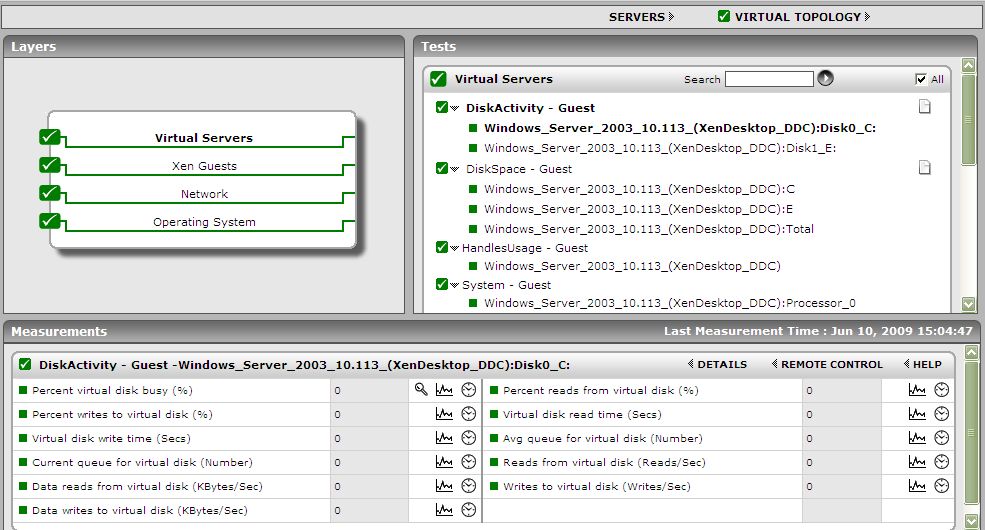
Figure 1 : The tests mapped to the Virtual Servers layer
If you now want the Server view of Figure 1, simply click on the Servers link above the list of tests in Figure 1 (indicated by the arrow).
Clicking on any of the guests in the Server view leads you to Figure 2 that displays all the performance metrics extracted from that guest, in real-time. You are thus enabled to cross-correlate across the various metrics, and quickly detect the root-cause of current/probable disturbances to the internal health of a guest. To view the time-of-day variations in a measure, you can view its graph by clicking on that measure in Figure 2.
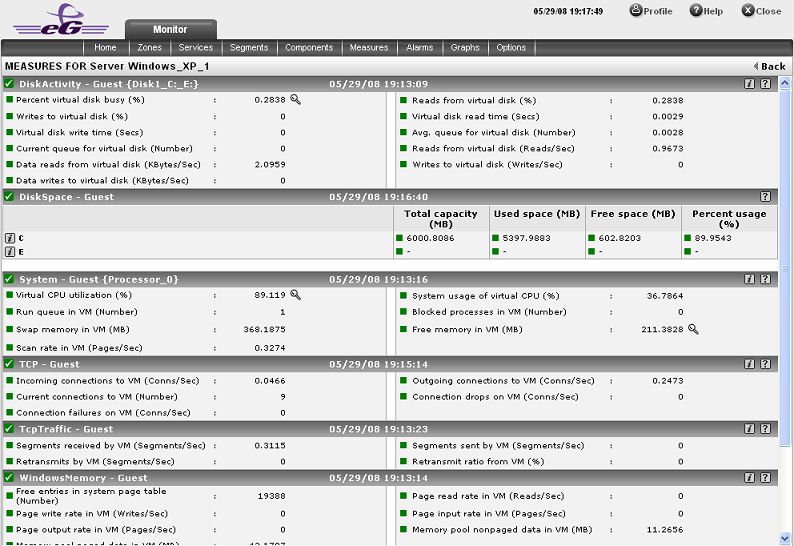
Figure 2 : Measures pertaining to a chosen guest
To view real-time graphs of pre-configured measures (pertaining to the RHEV Hypervisor and the guests operating on it), click on the live graph link in Figure 1. Alternatively, you can click on the  icon that appears in the Tests panel of the layer model page when the Inside View of VMs layer is clicked to view the live graph. The graph display that appears subsequently has been organized in such a way that next to every host-pertinent measure graph, the closely related guest-specific measure graph appears. This way, you can easily compare and correlate how well the physical CPU resources are being utilized by both the RHEV Hypervisor and the guests. On the basis of this analysis, you can proactively isolate potential performance issues, and also determine the root-cause of the issue - is it the RHEV Hypervisor? or is it the virtual guest? If you access this page from the LIVE GRAPH link in Figure 1, then, by default, you will view live graphs pertaining to the RHEV Hypervisor. However, you can select a different virtualized component-type and a different virtualized component using the type and Component Name lists (respectively).
