Monitor all aspects of Solaris and LDOMs performance. Know which domains are resource intensive and why. Get proactive alerts to detect and fix issues quickly.
Free TrialTrusted by leading companies


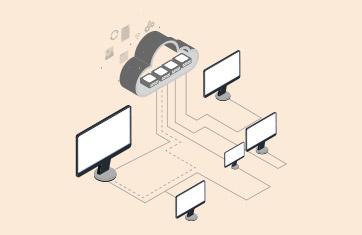
Solaris LDOMs is a server virtualization and partitioning technology that is used by many enterprises to host multiple instances of Solaris or Linux virtual machines (VMs) on a Sun server. The LDOMs (or Logical Domains) technology allows administrators to allocate a system's various resources, such as memory, CPUs, and devices, into logical groupings and create multiple, discrete systems, each with their own operating system, resources, and identity within a single computer system.
A Solaris LDOMs server has multiple guest domains and a single control domain for monitoring and reconfiguration of the guest domains. The guest domains are where the applications are hosted and can be independently powered on and off without affecting other domains. The applications on the logical domains use the virtual CPU/disk/memory resources that the hypervisor allocates to every guest.
As with any virtualization technology, while virtualization provides significant cost savings, it also makes monitoring and management more challenging. Since all the guests and the control domain share the physical resources available on the server, a malfunctioning application in one of the guests or the control domain can reduce the resources available to the other guests, thereby impacting the performance of applications running inside the guest VMs. Resource shortage on the physical server can also impact the performance of application executing on the guest VMs. And application performance is impacted if the logical domain used to host an application is not properly sized. A monitoring solution should be able to differentiate between these different scenarios that all result in application performance degradation.

With eG Innovations, we are reducing system maintenance and support costs, avoiding incremental IT spending and eliminating system downtime across the hospital. Performance and prediction reports help us optimize IT spending and save $100,000 per year.![]()

eG Enterprise offers real-time monitoring, diagnosis, and reporting for Solaris LDOMs server farms. An eG agent deployed on the control domain of the Solaris LDOMs server collects key metrics about the performance of the physical server and the control domain. The same agent auto-discovers the guest domains hosted on the physical server and tracks the resource usage of each of the guest domains.
Using patent monitoring technology, the eG agent monitors the fraction of physical resources that each logical domain is using, and by connecting to each logical domain, it also determines the exact application processes executing in each logical domain that is responsible for the resource usage. The combined inside and outside views of each logical domain provide a 360-degree view of performance of the Solaris LDOMs infrastructure.


With its ability to provide in-depth monitoring for key applications (e.g., web server, databases, middleware, etc.) hosted on Solaris LDOMs servers, eG Enterprise provides a single-pane-of-glass view into the entire infrastructure. The performance of the physical servers, guest VMs, and applications executing in the guest VMs can all be viewed from the same web console.
All the metrics collected by eG Enterprise are compared against thresholds to determine metrics that may indicate abnormality. The thresholds are either pre-configured based on industry standard best practices, fine-tuned by administrators, or automatically determined by eG Enterprise based on past history of the metrics.
From the Virtual Server layer, with one click, you can see the top 10 CPU processes that are running on that guest OS. This enables administrators to identify misbehaving processes within a guest, and if necessary, terminate them.

eG Enterprise uniquely offers the ability to perform root-cause diagnosis automatically without human intervention. This is achieved using a patented root-cause analysis engine that automatically correlates alerts from the physical servers, logical domains, and applications. Correlation is done in a multi-step manner. A hierarchical layer model of Solaris LDOMs servers is used to correlate physical server performance with logical domain performance. Solaris LDOMs virtual topology showing application to LDOMs server dependencies For example, excessive disk usage on the physical server will generate an alert at the operating system layer but will also cause secondary alerts within each guest OS. In this situation, eG Enterprise automatically downgrades the severity the alerts from the guest layer and highlights that the problem is being caused in the physical machine's operating system layer.

Using its real-time auto-discovery process, eG Enterprise maps applications to logical domains. This information is used to construct virtual topologies showing application to physical server and logical domain dependencies. The virtual topologies are used for application to Solaris LDOMs performance correlation.
Licensing of the eG Enterprise monitoring solution for LDOMs server is by the number of physical servers monitored and not based on the number of CPUs, memory available, or the number of guest VMs hosted on each server.