How to Proactively Discover, Diagnose and Resolve Performance Issues in Java Applications
Java-based applications are powering many business-critical IT services today and Java technology is widely used as the middleware on which the business logic of multi-tier infrastructures reside. Since the performance of the Java middleware tier has a significant impact on the performance of the business services it supports, monitoring is a necessity and not a choice.
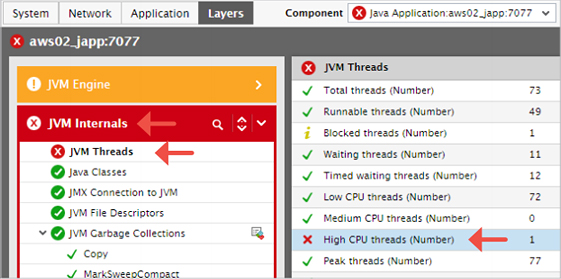
Monitoring of the Java Virtual Machine (JVM) is key to providing insights into performance issues that could have a significant impact on the supported business services. When there is a memory leak in the JVM, Garbage Collection problems, high CPU usage, thread deadlocks, etc., you need to be alerted immediately.
This white paper discusses many commonly faced Java performance issues and how to detect and diagnose them across the Java application stack to be able to get insights for faster troubleshooting and performance tuning. Learn how to ensure high-performing Java applications and stellar end user experience for the application end users.