English
 Deutsch
 Espanol
 Français
 Portuguese
 中文
中文 한국어
한국어 日本語
日本語
Omnissa Horizon Monitoring End-to-End
Specialized monitoring for Omnissa Horizon RDSH and VDI. Single console that monitors Omnissa Horizon end-to-end, every tier and every tier. Proactively detect VDI user experience issues by monitoring logon time, launch time, screen latency, etc. AIOps engine pinpoints the root-cause of VDI issues quickly.
Free TrialTrusted by leading companies


Why Omnissa Horizon Monitoring is Essential
Challenges in VDI environments
Omnissa Horizon environments are highly distributed, with user sessions, virtual machines, hosts, storage, and networks all contributing to the final experience. That complexity makes it difficult to pinpoint where performance problems begin, especially when multiple layers are involved at once.
Maintaining digital employee experience
For end users, Horizon performance is only as good as the experience they receive at login, during application use, and throughout the session. Monitoring helps ensure that digital employee experience stays consistent even as workloads, users, and infrastructure conditions change.

Reducing downtime and disruptions
When a Horizon issue affects login times, session quality, or application responsiveness, the impact is immediate and visible. Continuous monitoring helps teams detect problems earlier, shorten outages, and reduce the chance of widespread disruption.
Improving IT operational efficiency
Without deep visibility, IT teams often spend too much time gathering evidence before they can even begin troubleshooting. Monitoring improves operational efficiency by giving administrators the performance context they need to act quickly and confidently.
Common Omnissa Horizon Performance Challenges
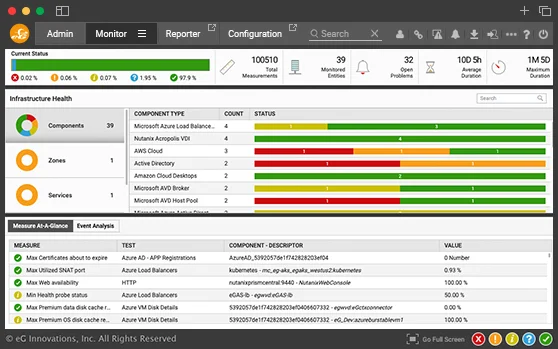
Intuitive Omnissa Horizon VDI Monitoring Dashboards, Analytics and Reports


eG Enterprise for Omnissa Horizon Monitoring

eG Enterprise is an end-to-end monitoring solution that provides inside and outside performance monitoring for virtual desktops powered by Omnissa Horizon. With eG Enterprise you can:
- Monitor and optimize digital employee experience (DEX).
- Get visibility into every layer and every tier of your IT infrastructure.
- Get to the root-cause of performance problems in one click.
- Go beyond VMware vROps with end-to-end visibility.
Flexible Deployment & Licensing Options
Simplify Omnissa Horizon workspace monitoring with eG Enterprise, a one-stop shop solution with actionable insight. Get the best VDI monitoring software at a very affordable price – monthly charge per user is less than the price of a daily cup of coffee.
SaaS deployment
SaaS deployment gives teams a faster way to start monitoring without managing all of the underlying platform infrastructure themselves.
On-premises deployment
On-premises deployment supports organizations that need local control, data residency alignment, or tighter internal governance.
Agent-based monitoring
Agent-based monitoring provides deeper visibility into desktop, host, and session behavior where detailed metrics are required.

Agentless monitoring
Agentless monitoring offers a lighter deployment model for environments where broad visibility is needed with minimal overhead.
MSP multi-tenant support
MSP multi-tenant support helps service providers monitor multiple customer environments while keeping operational separation clear.
eG Innovations delivers a robust, reliable and extremely valuable solution to deliver maximum uptime and user satisfaction. Pre-emptive alerting helps us to address performance issues immediately before they affect system and application availability.

Deep Visibility into Virtual Desktop Performance
Go beyond VMware Aria Ops, formally known as vROps, with end-to-end visibility across heterogeneous infrastructures and comprehensive operating system metrics from every VDI guest
CPU utilization monitoring
CPU visibility helps identify host saturation, session contention, and desktop resource pressure that can affect responsiveness.
Memory performance monitoring
Memory monitoring highlights pressure, consumption spikes, and inefficient allocation that can slow virtual desktops.
Disk I/O analytics
Disk I/O is a common source of latency in VDI environments, especially during logon storms or profile-heavy workloads.
Network traffic visibility
Network visibility helps uncover congestion, latency, and packet-related issues that affect session quality and application responsiveness.
GPU performance monitoring
GPU metrics are important for graphics-intensive workloads and for identifying whether acceleration resources are being used effectively.
Key Metrics for Monitoring
Omnissa Horizon Performance
-
Desktop/Application Pools
- Sessions by protocol (Blast Extreme, PCoIP, RDP)
- Desktop status (error, ready, available, unknown, idle, etc.)
- Desktop launch time
- Application launch time
-
Horizon Virtual Desktop Sessions
- User logon (user profile, Group Policy, script loading)
- User experience (RTT, frame rate, bandwidth, etc.)
- Session performance (CPU, GPU, memory, disk, network traffic, handles, etc.)
-
Horizon RDS Hosts
- User logins and disconnects
- Sessions (connected, idle, down, shadow, init, etc.)
- Application processes
- RDS resource utilization (disk, memory, CPU, GPU)
-
Horizon Connection Brokering
- Status
- License usage
- Current and highest sessions
- Database connectivity
- Active Directory access
- vCenter connectivity
- Events
- TCP port issues
-
All the Horizon Tiers
- Connection Server
- Identity Manager
- Unified Access Gateway
- Composer
- User Environment Manager
- ThinApp assignment
- App Volumes
- Instant Clone
-
Supporting Infrastructure
- Active Directory
- vSphere Hypervisor
- vCenter
- Operating System
- Server Hardware
- Storage
- Network
- Cloud
Proactive Horizon Logon Monitoring with Synthetic Simulation
- Simulate user logons and catch issues before real users are affected
- Measure time taken for every step of the logon process from browser access, authentication, session establishment and enumeration to application launch.
- Detect which step of the logon process is causing slowness.
- Test application/desktop availability and logon performance 24x7.
- Establish baselines and compare user experience across locations.

Full-Stack Visibility Across the Entire Horizon Ecosystem

Go beyond VMware vROps with end-to-end monitoring of heterogeneous infrastructures and
visibility of OS metrics from every VDI guest.
End-to-End Omnissa Horizon Monitoring and Automatic Root Cause Diagnosis
- For each VDI pool, host and farm, get workload details including desktops that are connected, disconnected, idle, unknown, on maintenance, etc.
- Track health metrics for Identity Manager, Security Server, EUM, Unified Access Gateway, etc. from a single pane of glass.
- Automatically correlate performance of Horizon infrastructure with the supporting tiers (network, storage, database, AD, etc.)
- Automatically identify the root cause of problems and speed up troubleshooting.

See What’s Causing Your Horizon Performance Issues
Get complete visibility across Horizon, supporting infrastructure, and user sessions—and quickly pinpoint the root cause from a single console.
Benefits of Omnissa Horizon Monitoring
Omnissa Horizon monitoring helps reduce downtime, speed up issue resolution, and improve the experience users have with virtual desktops. It also gives IT teams better visibility into resource usage, session behavior, and the causes of recurring issues.
For organizations running large or distributed VDI environments, this leads to more predictable operations and less time spent on reactive troubleshooting.
Omnissa Horizon Monitoring Use Cases
Common use cases include troubleshooting slow logons, identifying desktop slowness, validating session quality, tracking resource pressure, and understanding whether performance issues come from the host, network, or desktop layer. Monitoring also supports capacity planning and service-level reporting.
It is especially useful in environments where Horizon is supporting remote work, regulated workflows, or business-critical applications.
Why Choose eG Enterprise for Omnissa Horizon Monitoring
eG Enterprise provides end-to-end visibility for Horizon environments, from logon simulation and user experience analysis to resource monitoring and root cause diagnostics. It is designed to help teams monitor both what users experience and what the infrastructure is doing behind the scenes.
That combination of synthetic testing, deep diagnostics, and full-stack observability makes it easier to manage Horizon environments proactively and with less guesswork.
Frequently Asked Questions (FAQs) about Omnissa Horizon Monitoring
Omnissa Horizon monitoring is the practice of tracking the health, performance, and user experience of Horizon virtual desktop environments. It helps teams detect issues in sessions, desktops, hosts, networks, and supporting services.
Monitoring is important because Horizon VDI performance depends on many connected layers. Without visibility, it becomes difficult to identify bottlenecks and maintain a reliable user experience.
Start by measuring each stage of the login process, including authentication, profile loading, policy processing, and desktop startup. Monitoring tools like eG Enterprise that provide logon breakdowns make it easier to identify the specific source of delay.
Key metrics include login time, session response, CPU usage, memory usage, disk I/O, network latency, host load, and GPU utilization where relevant. These metrics help teams understand both performance and capacity health.
Synthetic monitoring improves Horizon performance by testing logon paths continuously and identifying delays before users are affected. It provides early warning of issues and helps validate service quality over time.
The best tool is one that provides full-stack visibility, synthetic logon testing, root cause analysis, and performance context across the virtual desktop stack. For Horizon, that means monitoring both user experience and infrastructure behavior together.
AIOps helps by identifying abnormal patterns, reducing alert noise, and prioritizing likely causes of performance issues. That makes it easier for teams to respond faster in complex VDI environments.
Yes. eG Enterprise is positioned to support monitoring across multiple virtual desktop platforms, which helps teams manage mixed VDI environments from a single console.
You identify root causes by correlating user experience symptoms with host, network, storage, and desktop metrics. Root cause analysis tools make it easier to move from a slow session to the underlying bottleneck.
End-to-end observability improves troubleshooting, reduces downtime, supports better capacity planning, and helps deliver a more consistent user experience. It also gives IT a clearer view of how Horizon behaves across the whole environment.