English
 Deutsch
 Espanol
 Français
 Portuguese
 中文
中文 한국어
한국어 日本語
日本語
NGINX monitoring to enhance web application performance
Monitor the availability, responsiveness, user experience, and processing capabilities of your NGINX web server to spot bottlenecks that are impacting the performance of your applications.
Free TrialTrusted by leading companies


Designed to handle tens of thousands of concurrent requests, NGINX is one of the fastest and highly scalable web servers around. Not only is NGINX a very efficient web server, but it is often widely used as a reverse proxy, HTTP cache, and load balancer. While Apache continues to be the most popular web server in use, NGINX has become the most popular web server among the web traffic web sites. Since they are often the front ends to business-critical web sites, availability and performance of NGINX servers is of vital importance.

Monitoring digital experience
web applications on NGINX

- Use a combination of synthetic monitoring and real user monitoring (RUM) to track user experience
- Identify remote locations that may be experiencing performance slowdown
- Report on Javascript errors and slow page groups to alert application operations teams of potential areas of concern
- Monitor availability and responsiveness of individual web servers from multiple locations and differentiate front-end slowness from backend slowness
eG Enterprise for NGINX server monitoring

Get complete visibility into your NGINX servers and all the underlying infrastructure to help you quickly get to the root cause of performance problems.
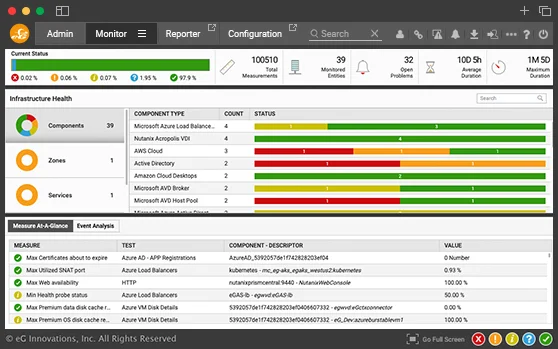
- Out-of-the-box monitoring, reporting, alerting, dashboards, and reports from a single pane of glass
- Monitor every layer and every tier of each of the web application tiers
- Auto-baseline traffic to each web site. Understand time of day and day of week behavior
With eG Innovations, we are reducing system maintenance and support costs, avoiding incremental IT spending and eliminating system downtime across the hospital. Performance and prediction reports help us optimize IT spending and save $100,000 per year.

Track NGINX server health
- Get key performance indicators about each NGINX server, including busy workers, number of requests, and active/dropped connections
- Track system performance metrics (CPU, memory, and more) to identify the root cause
- Get alerted to performance deviations, configuration changes, and excessive resource usage
- Track health and availability of network traffic, TCP requests, and connectivity, along with metrics like retransmissions, round-trip time, and throughput
- Monitor web server logs to track overall traffic volume, pages that are slow and those that returned in error
Get end-to-end web application insights
- Obtain application topology maps that depict the NGINX web servers and their dependencies with the rest of the application delivery chain
- Monitor every layer and every tier of each of the web application tiers
- Detect performance anomalies and identify the root-cause of slowdowns: whether it is the CPU saturation slowing down your database or a storage failure that is affecting performance
- Get out-of-the-box monitoring, reporting, alerting, dashboards, and reports from a single pane of glass

- Analyze transaction processing at the application server tier and report on the slowest database queries so administrators and developers can fine-tune the application
What Ngnix monitoring with eG Enterprise reveals
| External monitoring |
|
| Internal transaction monitoring |
|
| Web site monitoring |
|
| Bottleneck detection |
|
| Capacity planning |
|
| Log file monitoring |
|