English
 Deutsch
 Espanol
 Français
 Portuguese
 中文
 한국어
 日本語



Owing to the ability to operate on heterogeneous platforms, PostgreSQL databases have become the preferred backend for many mission-critical service offerings. A second’s non-availability of the server, a sudden or steady erosion of free space in one or more of its tablespaces, ineffective caching by the server, and intense locking can cause serious harm, not only to the performance of the PostgreSQL server in question, but also the services that rely on it.

Performance monitoring of PostgreSQL is essential to ensure optimal database performance, identify bottlenecks, and maintain system efficiency. By monitoring metrics such as query execution time, resource utilization, and database locks, organizations can proactively address performance issues, optimize database configuration, and improve overall application responsiveness. Timely detection of performance degradation can prevent downtime, enhance user experience, and support scalable growth, making PostgreSQL performance monitoring indispensable for maintaining high-performing database environments.
AIOps-powered PostgreSQL database monitoring
eG Enterprise is simple to deploy and effortless to manage:
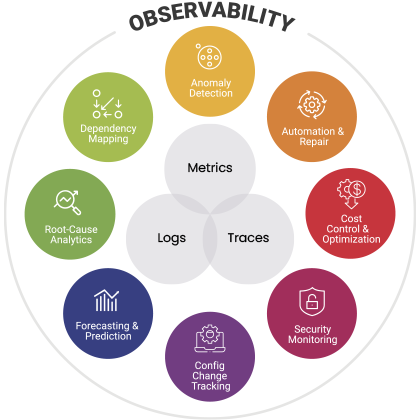
- Intelligent domain-aware auto-deploy and auto-discovery technologies understand database dependencies between cloud, application, middleware, hardware, network, storage and more.
- Out-of-the-box metric thresholds and AIOps-powered auto-baselining provide ready-to-go alerting and anomaly detection without manual effort and configuration.
- AIOps intelligent correlation technologies prevent alert storms and provide one-click root-cause detailed diagnostics for rapid troubleshooting. Ensure that only database related problems are routed to database administrators.
- eG Enterprise’s simple, intuitive interface is suitable for use by the whole organization including helpdesk operators, platform engineers, application developers and management.
- Deploy and start monitoring without any need for professional services or extensive training. Available to deploy as turnkey managed SaaS or for deployment in cloud or on-premises to suit your data governance and compliance requirements.
Single-Pane-of-Glass experience for PostgreSQL databases for the whole organization

Total PostgreSQL database observability in context

Instant answers to key questions in PostgreSQL environments
eG Enterprise enables database administrators to find quick and accurate answers to performance questions, such as:
- Is the database server available? If so, how quickly does it repond to client queries?
- Is the buffer cache utilized optimally, or are requests for heap blocks and index blocks being increasingly serviced by direct disk accesses?
- Is any tablespace running low on free space? If so, which one?
- How well does the background writer perform checkpointing? Is too much I/O load being imposed by the writer in the process of checkpointing?
- Are too many rollbacks occurring on any database? If so, which one?
- Are indexes used effectively?
- Are there any useless/unused indexes on the server? Which ones are these?
- Have too many sequential scans occurred on any table?
- Are inserts, updates, and deletes happening too slowly on any table?
- Is any table experiencing extreme or major issues while querying data from the server?
- Does any user have too many idle connections on the server?
- Is any user’s connection waiting for a locked resource to be released?
- Are too many locks being currently held on the server? Which lock mode is the maximum?
- Are any queries running for too long a time on the server? If so, which ones are these?