JEUS application server monitoring

Monitor your JEUS application stack within a single-pane-of-glass and get visibility into the performance of your JVM, web containers, application code, database connections, slow queries, external service calls, and more.

Free Trial

Trusted by leading companies

Why is JEUS Monitoring needed?

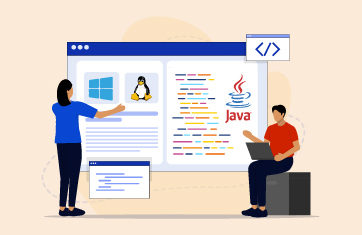
The JEUS application server is a popular application server for Java web applications. Implementing a "pure Java" HTTP web server, JEUS supports Java Servlets, Java Server Pages, and WebSockets, and can support highly transactional Java applications and services.

To ensure high application performance, it is essential to monitor the JEUS application server, the Java Virtual Machine (JVM) it uses, the application components it hosts, and the infrastructure tiers supporting it. IT teams and developers need the capability to proactively detect performance problems before they impact end-users of the Java application.

Monitoring All Aspects of JEUS performance

Full stack JEUS performance monitoring

eG Enterprise is a full-stack application performance monitoring that delivers in-depth insights into Java applications powered by JEUS. From an intuitive web console, application owners, developers, and administrators can:

JEUS logo
  • Monitor the JVM, the JEUS web container, and application transaction profiling from a single console
  • Track problematic application code, database connections, slow queries, external web service calls, and more
  • Get deep diagnostics on all aspects of JEUS performance including Connectors, Servlets, Thread pools, Jasper Compiler, Sessions and caching

eG Enterprise for JEUS Monitoring

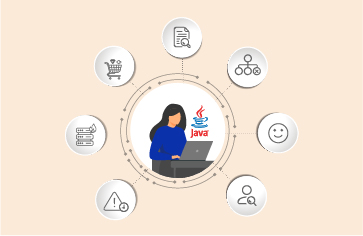
eG Enterprise helps you enhance the performance of your JEUS applications:

  • Monitor real user experience and proactively detect any slowness
  • Troubleshoot faster by gaining deep performance insights and KPIs about JEUS performance
  • Single monitor for everything Java: JVMs, containers, web front end, databases, and underlying physical and virtual infrastructure
  • Eliminate finger-pointing between IT Ops, DevOps, and developers by automatically pinpointing the root cause of performance issues
See Demo

What eG Enterprise’s JEUS Monitoring offers

Troubleshoot faster with deep JEUS insights

Get comprehensive view of all JEUS performance metrics in one place.

  • Monitor the processing of requests by each connector (response time, errors, workload, etc.)
  • Monitor sessions to each application hosted on JEUS to identify which application is imposing the highest load
  • Track every servlet executing on JEUS and measure requests, processing time, and errors
  • Assess whether the JEUS server has been configured with enough threads to handle workloads
  • Isolate business transactions affected due to JEUS performance
  • Catch out-of-memory exceptions and memory leaks in the JVM

Get code-level visibility for application performance optimization

eG Enterprise allows developers to easily identify Java code-level issues.

  • Automatically get alerted to slow Java application transactions
  • Analyze the transaction flow using distributed transaction tracing and determine where slowness is occurring (app server, database, remote calls)
  • Easily drill down to get Java code-level visibility

Answer key JEUS performance questions

  • Which of the Java business transactions are slow, stalled or having errors?Where is the response time slowdown: in the Java code,in the database queries, or in external web service calls?
  • How many transactions are handled by each JEUS engine?
  • Is the workload balanced across all the JEUS servers in the farm? Do you need more JEUS Servers to handle the load?
  • Are Java Servlets executing within acceptable processing thresholds?
  • Is the web container configured correctly to handle the incoming workload?

Going beyond monitoring the JEUS web container

eG Enterprise delivers total performance assurance for web applications powered by Java technology:

  • User experience monitoring: Using real user monitoring and synthetic transaction monitoring, you can identify user experience issues and slow transactions. Find out if the issue is with the browser, network, or server side.
  • Business transaction tracing: Trace slow transactions across the Java application architecture and isolate server-side issues causing transaction slowdown.
  • In-depth JVM monitoring: Comprehensively monitor every aspect of JVM performance, including CPU, heap and non-heap memory, threads, classes, garbage collection, and more.

Start your free trial or schedule a custom demo with an engineer

  • Works on cloud environments, hybrid cloud setups and on-premises deployments
  • Deploy eG Enterprise using our SaaS platform or on-premises
  • Suitable for monitoring applications, digital workspaces and IT infrastructures
Please Enter Valid Work Email
eG Enterprise