English
 Deutsch
 Espanol
 Français
 Portuguese
 中文
 한국어
 日本語

Datadog vs eG Enterprise: Full-Stack Monitoring for Hybrid IT and Digital Workspaces
Trusted by leading companies


A user calls the service desk at 9:15 on Monday and says their virtual desktop session is slow. You open the dashboard. The session host shows a CPU utilization of only 30%, memory usage is normal, the network graph is flat, nothing is alerting. Every chart agrees that the infrastructure is healthy. The user is still waiting.
The cause is something the charts do not highlight. A logon phase was stalled on a profile share. A display protocol was starved of bandwidth. A broker was slow to enumerate applications. A datastore was under contention from a workload in a different tier entirely.
Most teams looking for answers to this scenario already run Datadog, and the gap they run into is not coverage. Datadog collects metrics from a remarkable range of technologies. The gap is expertise: knowing what a logon phase is, what an SAP work process should be doing, what healthy looks like for a storage array or a domain controller. Collecting metrics about a machine is a different thing from understanding the technology running on it.
This page is an honest comparison. Where Datadog is the better tool, we say so first. Then we cover where built-in domain expertise changes the outcome, and how the two products, Datadog and eG Enterprise, can run alongside each other.
Where Datadog is the Right Choice
Datadog is a cloud-focused platform. Deployed as SaaS, it has great coverage of cloud platforms and services as well as serverless technologies, bringing metrics, traces, logs, real user data and security signals into one searchable place. Tracing libraries are available for twelve languages, and OpenTelemetry is supported natively.
If your organization is predominantly cloud-based with SaaS applications, Datadog is a good choice. The same holds for log analytics at scale, cloud security and incident response.

Why Teams Running Datadog Add eG Enterprise
Nobody adds a second monitoring platform over a missing feature. They add one because of a structural difference.
Every capability has its own meter. Datadog prices each capability on its own unit. Infrastructure and APM are priced per host, log analysis by volume, real user monitoring per session, synthetics per test run, network monitoring per device, on-call per seat, and AI actions in credits. Every single capability has a cost, and the meters move with engineering details your team decides daily: metric tag cardinality, container counts, log volume.

Coverage is not expertise. Datadog can collect key metrics from a very wide set of technologies, and for virtualization platforms, packaged applications like SAP, Microsoft 365 and Siebel, storage systems and infrastructure services like Active Directory, that is what it does: collects metrics and presents them. What it does not carry is a built-in model of those technologies, of how their layers depend on each other and what healthy looks like for each one. Coverage gives your team charts. Diagnosis still relies on human expertise.
It runs one way. Datadog is SaaS, in the regions Datadog operates. For many organizations that is fine. For a bank, a hospital, a government agency or anyone running an air-gapped estate, monitoring data that must live in the vendor’s cloud is a permanent objection rather than a preference.
Built-In Domain Expertise:
What eG Enterprise Changes
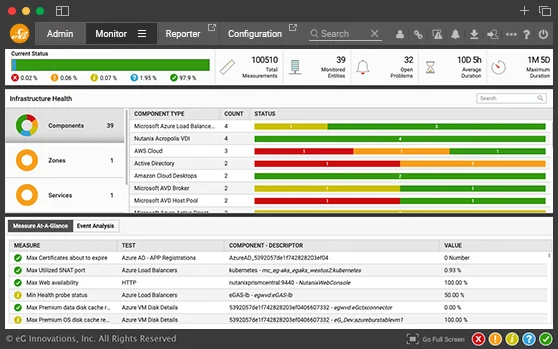
eG Enterprise embeds an expert model of every technology it monitors, across 650+ technologies: firewalls, load balancers, middleware, web applications, thick-client applications, databases, messaging systems, virtualization, containers, desktops and more. The full list is published: See supported technologies. Each component gets a full-stack layered view, so what is working and what is not is visible at a glance. Dependency maps are auto-discovered. Color-coded topology walks you from the symptom to the layer at fault, and problem demarcation is built in, so the ticket lands with the right team the first time.
Detection is statistical: automatic baselines on every metric, anomalies, trends and rate of change, learned rather than configured. Gen AI sits on top as a complement, helping your team consume and interpret what the platform has already detected. Datadog approaches the same problem data-first: collect everything, present dashboards and reports, and investigate by asking its AI assistant to correlate across the telemetry. Both approaches produce answers. One of them produces answers before your team starts asking.
Three examples make the difference concrete.


The same pattern shows in the platforms enterprises still run. Datadog supports AIX through a separate agent, and APM and log management are not available on it. eG Enterprise ships full-function agents for AIX, HP-UX and Solaris, and a dedicated model for IBM i on AS400, so the legacy tier is monitored the same way as everything else.
The Clearest Example: Virtual Desktops
Go back to the user waiting at 9:15. Nothing shows the expertise gap faster than a virtual desktop estate.
Datadog will show you that desktop VM in detail: CPU, memory, disk, processes, services, event logs. What it does not carry is a model of what a Citrix or AVD session is. That a logon has phases, and each phase has an owner. That a display protocol has latency of its own, separate from the network’s. That a session belongs to a named person who is currently unhappy.

eG Enterprise starts there. Logon time broken into its phases: authentication, profile load, group policy, printer mapping, logon scripts, session establishment. Protocol metrics for ICA and EDT, PCoIP and Blast, RemoteFX and RDP. Search a user by name and see their session, the VDA behind it, the delivery infrastructure behind that, and the hypervisor and datastore below, correlated in one view. The same model covers Citrix, Omnissa Horizon, Azure Virtual Desktop, Amazon WorkSpaces and Windows 365, and the infrastructure services where slow logons usually live: Active Directory, DNS, DHCP, file, profile and print servers, each with a purpose-built monitoring model.
Synthetic coverage in Datadog supports only browser accesses. eG Enterprise goes well beyond this, including a logon simulator for each digital workspace technology it supports, launching real sessions on a schedule and timing every phase, and even simulating full user sessions in web and thick-client applications using OCR technology. This is the difference between a Tuesday-morning alert and a Wednesday escalation. You can run the free Citrix logon simulator against your own farm today.
St. Charles Health System cut login times in their Citrix environment by 50%, by finding causes their previous tooling could only describe. Read the case study

A Bill You Can Forecast
If you have priced workspace monitoring on a consumption platform, you know the problem: every desktop VM is a monitored host, and that is before log analysis, custom metrics or synthetic runs are added. That arithmetic is what sends most workspace teams looking for a different answer, and it is why so many virtual desktop estates end up monitored by almost nothing.
eG Enterprise counts differently. Licenses are per operating system instance, regardless of cores, sockets or memory. Several applications on one server is still one license. Digital workspaces are licensed by concurrent users, measured as the peak in any 30-minute window, so one person with five sessions is one license. Licenses are transportable: when a technology is retired, its license moves to whatever replaced it. Monitoring data volume is not a billing dimension. Neither is metric cardinality, container count or test frequency.

Ownership is a separate question. eG Enterprise is available as a perpetual license, as a subscription, or as SaaS. Datadog is available as a subscription to its cloud service. With a perpetual license the software keeps running and your monitoring history stays where it is, whatever happens to the contract.

Run It Where Your Rules Require
eG Enterprise runs where you decide. On-premises in your own datacenter, in your own cloud tenancy, as SaaS in a dedicated or shared model, or fully air-gapped with no outbound connection at all. It is the same product either way, so the deployment decision is yours to make on operational grounds.
For a regulated organization the consequence arrives before any feature is discussed. Deploy in your own environment and your monitoring data stays in the country and under the controls you chose. Certifications matter on both sides, but the only structural answer to "this data cannot leave our environment" is not sending it anywhere. Retention changes too: on-premises, history is governed by your storage and your policy rather than a subscription tier.

DKV Mobility runs eG Enterprise on-premises across 50 countries for exactly this reason. The deployment supports the regulatory obligations they answer to, and it is verified in their internal and external audits. Read the case study

For Managed Service Providers
If you deliver monitoring as a service, the requirements change. You need to run it yourself, put your branding on it, and quote a customer a monthly figure you can hold for the length of the contract.
eG Enterprise is built to be operated by service providers. Each customer gets their own views, separated by design rather than by permissions inside a shared tenancy, and yet the service provider gets to consolidate tenants into one view for your NOC. Licenses are transportable between technologies, so a customer’s changing estate does not send you back for a new quote. Because licensing counts infrastructure and users rather than telemetry, the number you quote in January is the number you are still living with in November. You also get to sell value-added services across virtualization, databases, workspace platforms and enterprise applications, under your own brand.

Spadafy built a healthcare VDI managed service on this model, and can show a hospital’s IT team whether a problem sits in the VDI service or in their own application. Read the case study

Datadog vs eG Enterprise: Feature Comparison
| Datadog | eG Enterprise | |
|---|---|---|
| Designed for | Cloud platforms and services; developer, DevOps and SRE teams | Hybrid enterprise IT and digital workspaces; central IT operations teams |
| Deployment | SaaS, in the region you select | On-premises, your own cloud tenancy, SaaS, or fully air-gapped |
| Ownership model | SaaS | Perpetual, subscription, or SaaS |
| Licensing basis | Hosts, containers, custom metrics, log volume, sessions, test runs, devices, seats, AI credits | Operating systems, hypervisors, storage devices, concurrent users, nodes running synthetic checks |
| Diagnosis scope | Applications and cloud services their agents instrument | Application through hypervisor, database, storage and infrastructure services |
| Digital workspace (Citrix, AVD, Horizon, WorkSpaces) | Infrastructure-level visibility of the desktop VMs | Session-level: logon phases, protocol metrics, per-user diagnosis, delivery infrastructure; logon simulators for each workspace technology |
| Synthetic monitoring | API, web and mobile app testing on real devices | API and web, plus full user-session simulation of web and thick-client applications (OCR-based) and workspace logon simulation |
| Virtualization | Overall coverage of common hypervisors. Additional agent and licensing per VM. Correlation is manual. | Best-of-breed: inside and outside views of each VM, single license covering the hypervisor and its VMs, VM-to-hypervisor correlation built in |
| Storage | Cloud object storage; arrays through marketplace integrations and SNMP | ~40 array models with dedicated monitoring, plus SAN switches |
| Packaged enterprise apps | SAP HANA natively; deeper SAP through a third-party marketplace product | SAP certified for RISE with S/4HANA Cloud, plus Siebel, Dynamics, PeopleSoft |
| Infrastructure services (AD, Entra ID, DNS, file, print) | Performance counters and a black-box DNS check | Purpose-built models for Active Directory, domain controllers, Entra ID, DNS, DHCP, file, profile and print servers |
| Legacy and Unix platforms | AIX through a separate agent; APM and log management are not available on it | Full-function agents for AIX, HP-UX and Solaris, plus a dedicated model for IBM i on AS400 |
| Server platforms | Windows, Linux, macOS | Windows, Linux, AIX, HP-UX, Solaris, macOS |
| Database depth | Query-level on three engines | Query-level across 30+ engines, including legacy |
| Real user monitoring | Browser and mobile, with session replay | Browser and mobile |
| Log analytics | A core strength: ingest, indexing, tiered retention, pipelines | Pattern-based log alerting within unified monitoring |
| Security | A core strength: cloud SIEM, workload protection, cloud posture, app and API protection | Security device health; not a SIEM |
| Kubernetes and serverless | A core strength, including autoscaling and function-level monitoring | Clusters and nodes monitored as part of the wider estate |
| OpenTelemetry ingest | First-class, including a collector embedded in the agent | Not supported today |
| APM language coverage | Wider: twelve official tracing libraries | Java, .NET, .NET Core, PHP, Node.js |
| Incident response and on-call | Native on-call, incident management and event correlation | Alarm escalation; integrates with your on-call and ITSM tools |
| Cloud and containers | Yes | Yes |
| MSP operation | Partner program with parent and child organizations in one cloud | Multi-tenant deployments, white-label, transportable licenses |
What Changes When
One Platform
Covers the Whole Estate
A global healthcare and medical-technology company
consolidated synthetic monitoring for web, thick-client and voice applications onto eG Enterprise across 12 locations, running hundreds of scripts in production. Licensing per node rather than per script is what made consolidation at that scale viable, and the team estimates more than 80% lower total cost of ownership than its previous approach.
Read the case study.

Community Care Physicians
monitors 750 servers, including 260 Citrix servers, alongside 200+ medical
applications, Office 365 and multiple EHR systems. Identifying and fixing a
problem used to take 20 to 30 minutes and now takes about five, because the
topology view shows the team whether the network, Citrix or the application
is at fault. A logon simulator also replaced a 20-item morning checklist,
saving 30 to 40 minutes every day. Read the case study.

KT&G
monitors an SAP ERP landscape used by 4,400 employees, spanning ABAP,
Java, BusinessObjects, Web Dispatchers and HANA across AIX and Linux
servers. They evaluated several APM and observability platforms before
finding one that covered the SAP infrastructure, the transactions and
the user experience together. MTTR has fallen significantly, and they
expect the platform to pay for itself in under three years.
Read the case study.

None of these teams were short of dashboards. They were short of an answer.
Common Questions About Datadog Alternatives
For hybrid enterprise estates, often yes. eG Enterprise covers APM, real user and synthetic monitoring, infrastructure, virtualization, databases, storage, network devices and digital workspaces in one platform. Two honest exceptions. If cloud security is central to how your team works, Datadog does more there. If your applications are written in Python, Go or Ruby, eG’s APM agents do not cover those languages today. Most teams we talk to keep Datadog for the cloud applications they build and rely on eG Enterprise for the workspace and the infrastructure underneath.
Yes, and it is the most common pattern. Datadog stays on the applications your developers instrument. eG Enterprise takes the digital workspace, virtualization, databases, packaged applications and infrastructure services. Alerts from both can land in the same ITSM or on-call tool, so your team still works one queue.
No. eG Enterprise does not currently ingest OpenTelemetry or OTLP data.
No. eG Enterprise monitors logs for patterns and raises alarms on them: Windows event logs with policies, regex-based log monitoring, syslog. That is, it filters at source. It is not a log aggregation platform and is not positioned as one. Teams that need the entire logs available for search, indexing and rehydration at scale keep Datadog for that.
Real APM: transaction tracing, code-level diagnostics and application topology for Java, .NET, .NET Core, PHP and Node.js. The difference is that the transaction view sits in the same model as the infrastructure beneath it, so a slow transaction traces to the database lock or the contended host that caused it, without leaving the console.
Yes. eG Enterprise provides real user monitoring for mobile apps on Android and iOS, covering native apps and hybrid frameworks including React Native and Flutter. It reports app launch time, active users, crash rate with crash diagnosis, Apdex and third-party call performance, segmented by app version, operating system and device type. https://docs.eginnovations.com/eG-Documentation.htm
By what you run: operating system instances, hypervisors, storage devices, nodes running synthetic checks, or concurrent users for digital workspaces. Not by data volume, metric cardinality or user seats. See pricing
A discovery of what you monitor today, agent deployment, and configuration of the tiers that were not covered, which is usually where the useful surprises appear. eG Enterprise implementations include professional services rather than leaving you to self-serve, so scope and timeline come from a real conversation about your environment.
Yes. eG Enterprise provides end-to-end monitoring for Citrix and Azure Virtual Desktop, including user experience, logon performance, sessions, delivery components, virtual machines, and supporting infrastructure. It also provides automated root-cause diagnosis, capacity insights, and synthetic logon simulation.
Datadog collects infrastructure metrics for platforms such as vSphere and Hyper-V. eG Enterprise adds purpose-built virtualization monitoring with correlated inside-and-outside VM views, VM-to-hypervisor mapping, automated root-cause diagnosis, and capacity planning across hosts, virtual machines, applications, storage, and networks.
See It on Your Own Environment
There is one test worth running. Point a monitoring platform at the problem you have not been able to solve.
Bring us the logon nobody can explain. The virtual desktop farm that looks healthy in every chart while users complain. The application slowdown that three tools have described and none has diagnosed.
Or start a free trial if you would rather begin on your own.