Learn how storage failures in a VMware ESXi environment were diagnosed using unified monitoring to identify root cause and restore performance quickly.
Overview: Storage Failure in VMware ESXi Environment
IT problems happen even in the best architected infrastructure due to configuration changes, failures, upgrades and such. How quickly and effectively you can detect and resolve such problems dictates how efficient your IT operation is. Today, I’ll cover how eG Enterprise helped us troubleshoot a hardware failure (a storage battery failure) that that caused a cascade of failures in a VMware ESXi infrastructure.
On Dec 5th 2025, an environment monitored by eG Enterprise started experiencing performance issues and multiple alerts across multiple components were triggered.
Virtual Infrastructure Perspective: Identifying Performance Issues
The VMware ESXi environment was configured to support hundreds of VMs hosting a variety of business-critical workloads including Tomcat application servers and databases.
eG Enterprise provides in-depth monitoring for VMware ESXi servers. Using VMware APIs, monitoring is performed in an agentless manner. The metrics collected cover all key components of a VMware server including the hardware, storage LUNs, datastores, hypervisor memory and CPU usage, physical interfaces, virtual switches, virtual machines and their resource usage levels, etc. More details of eG Enterprise’s virtualization monitoring capabilities and its unique inside/outside monitoring technology for virtual machines are available, see: VMware Monitoring Tools | eG Innovations.
On 5th Dec 2025, alerts were triggered because many of the ESXi server’s datastores were experiencing sudden increased latency. The figure below shows that the write latencies went up several times.
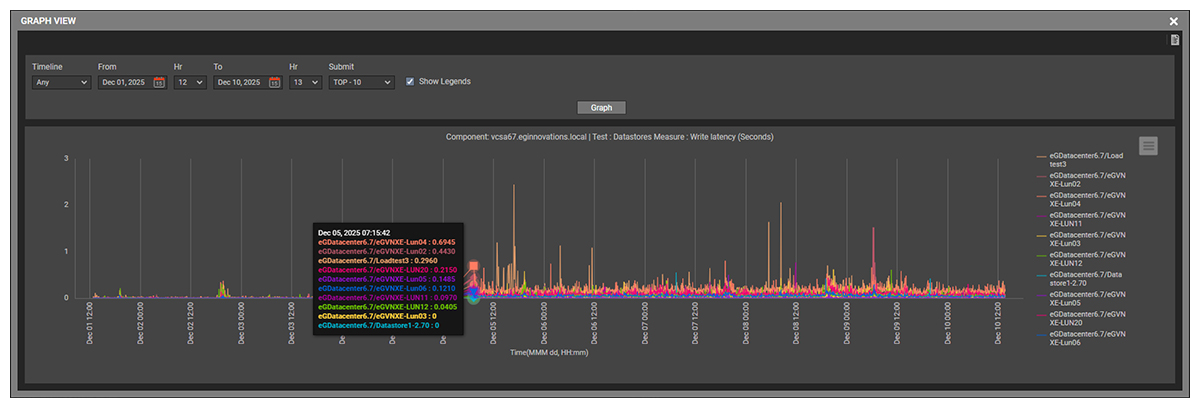
Monitoring of the VMs also revealed slow disk read times and this was causing business-critical applications to be slower than normal. At this point, the virtual administrator could see that a problem existed but had insufficient information to identify _why_ the issue had arisen.
Storage Layer Analysis: SAN, LUN & Datastore Monitoring
eG Enterprise’s unified monitoring capabilities allow virtual infrastructure, storage, network, and application components to be monitored from the same tool.
In an ESXi infrastructure, a SAN (Storage Area Network) is a dedicated, high-performance storage network that provides shared block-level storage to ESXi hosts. A SAN is where your virtual machine disks live, separate from the ESXi servers themselves.
The SAN was connected to multiple ESXi servers within the cluster. A LUN (Logical Unit Number) in SAN storage is a logical slice of storage carved out of a SAN and presented to a server or hypervisor as a disk. Several LUNs had been created in the SAN storage and presented to the ESXi cluster as datastores. All virtual machine files and virtual disks in the ESXi cluster resided on these SAN‑provisioned datastores.
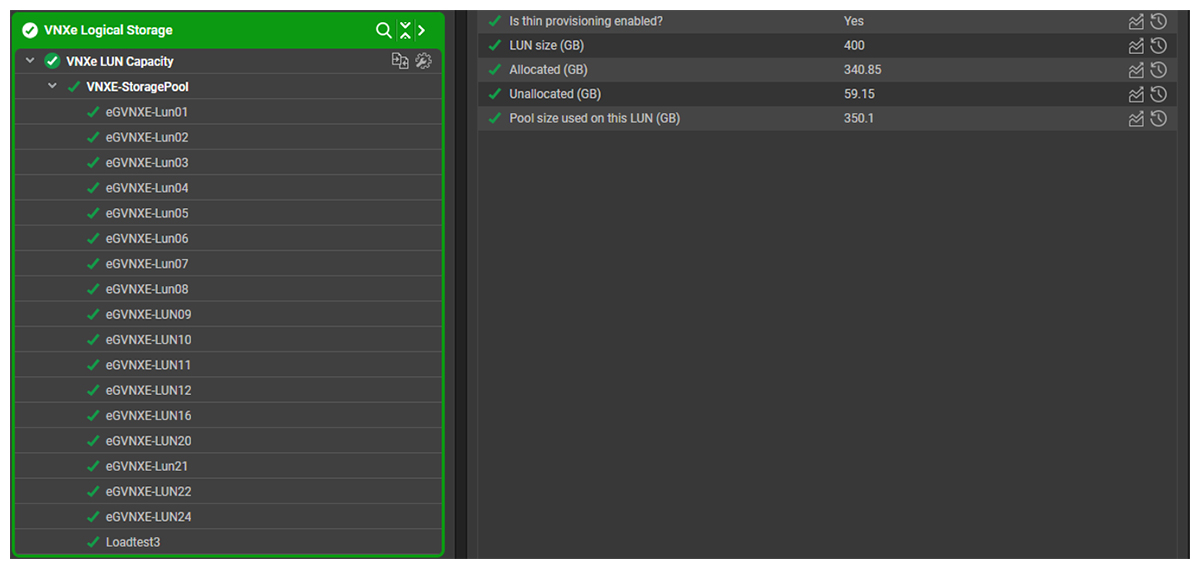
eG Enterprise monitors storage devices using CLI, APIs, SNMP and other mechanisms. Monitoring of storage LUN capacity (see Figure 2) did not reveal a problem.
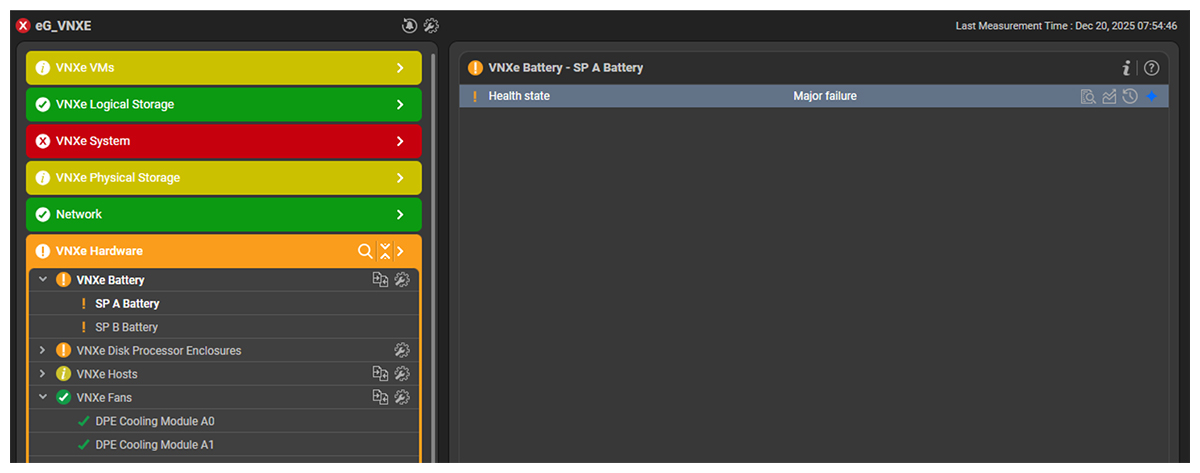
At the same time, when high write latencies were seen on ESXi datastores, alerts were also being triggered from the storage components. An alert was raised about specific failure with the batteries on the VNXe storage (see Figure 3).
Root Cause Analysis: Storage Battery Failure
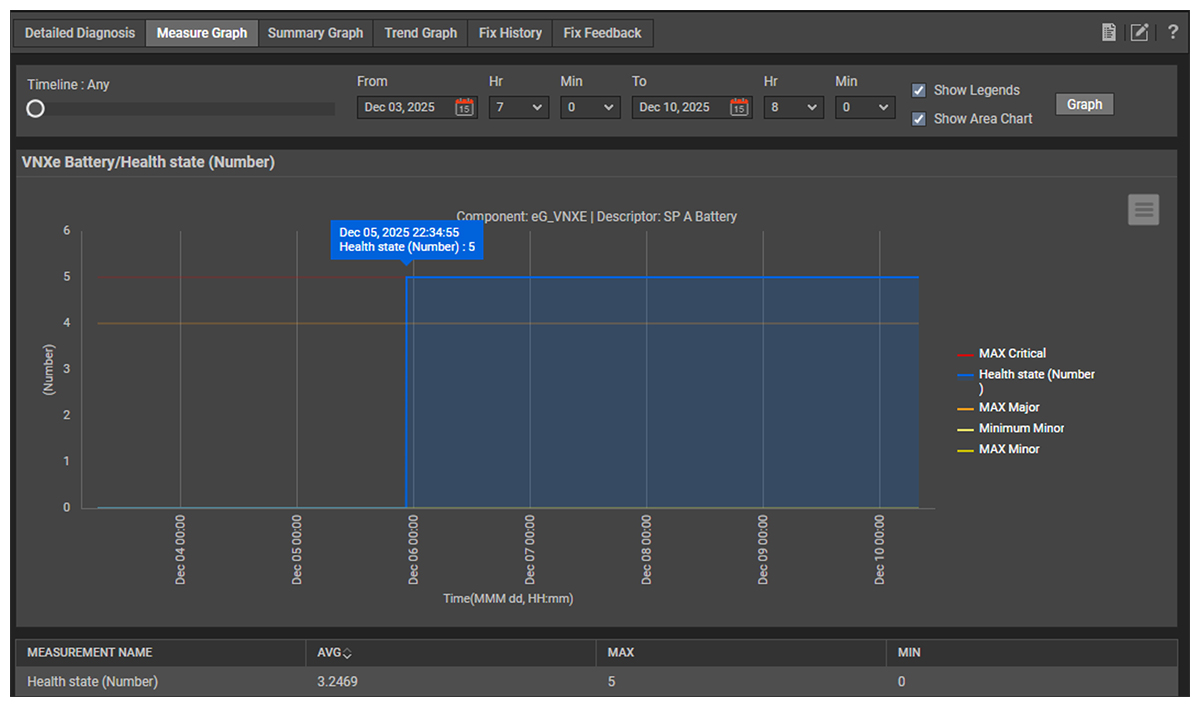
A graph of the health state of the VNXe battery shows that the health state degraded exactly when high latency was seen for writes (see Figure 4). A failed storage battery results in the cache being disabled. When the cache is unavailable, I/O performance across all LUNs is impacted, which leads to degraded VM performance and latency issues across the ESXi hosts. This explains the effects that were seen across the ESXi infrastructure.
Importance of End-to-End Observability Across IT Layers
This case highlights the need for IT teams to have visibility beyond point solutions. The degradation in the VM performance showed up in the vCenter console and an ESXi administrator relying on vCenter alone would have seen the performance degradation. However, without visibility into the storage layers, the true root-cause of the storage battery would not have been identified.
By providing both the virtualization admin and the storage admin with a unified view of all components and tiers, eG Enterprise was able to provide unified end-to-end visibility in a single pane of glass console, enabling fast and accurate diagnosis of the problem. If the admins had had fragmented views, the virtual administrator would not have had visibility on the root-cause of failure of the storage battery – the key information as to _why_ the VMs were experiencing performance issues and latency.
How eG Enterprise Enabled Faster Troubleshooting
eG Enterprise is a domain-aware AIOps observability platform and as such automatically collected the right metrics from the storage layers as well as the VMware environment. Cross-tier visibility enabled the true root-cause to be rapidly and automatically identified and alerts raised. In this case the visibility into the storage hardware, specifically the battery health, ensured that secondary symptoms seen in vSphere and the ESXi layer were not a distraction from the primary issue and time was not wasted trying to determine if the fault lay with the VMware components.
Key Learnings from the VMware Storage Failure Case Study
Unified observability that ensured metrics and signals were collected across both the virtualization and storage layers ensured that the right data to diagnose the issue was collected without visibility gaps. Having automated monitoring and alerting in place for the battery health metric of the storage ensured that the administrator was actively notified of the issue. The key lessons to take away are that unified observability across virtualization and storage layers enabled rapid root-cause identification that siloed monitoring tools would have missed, and that out-of-the-box alerting provided by eG Enterprise saves time.
Best Practices for Monitoring VMware & Storage Infrastructure
Best practices for monitoring VMware storage that this case study has highlighted include:
eG Enterprise is an Observability solution for Modern IT. Monitor digital workspaces,
web applications, SaaS services, cloud and containers from a single pane of glass.
- Using monitoring tools that cover not only VMware components but underlying storage such as infrastructure. Unified monitoring should monitor hypervisors, storage arrays, networks, VMs, and applications from a single platform to eliminate monitoring silos and accelerate root-cause analysis.
- Monitor Storage Latency Continuously. Track datastore and LUN read/write latency, IOPS, throughput, and queue depth. Sudden latency spikes are often early indicators of SAN or hardware failures.
- Correlate VM Performance with Storage Health. Slow VM response times may originate from storage subsystem issues rather than CPU or memory shortages. Correlation is essential for accurate diagnosis.
- Ensure automatic alerts are in place that will proactively notify the administrator of issues. Choosing tools such as eG Enterprise that configure alerting automatically will save significant effort to do this.
- Correlate User Experience with Infrastructure Metrics. Business impact is often first seen as application slowness or VM delays. Monitoring should connect infrastructure degradation directly to user experience.
eG Enterprise is an Observability solution for Modern IT. Monitor digital workspaces,
web applications, SaaS services, cloud and containers from a single pane of glass.
Frequently Asked Questions
Storage failures in VMware ESXi environments typically stem from issues with physical storage hardware, network misconfigurations, or metadata corruption, often leading to disconnected LUNs, VM inaccessibility, or severe performance degradation.
Storage latency directly affects how quickly a virtual machine can read and write data to disk. When latency increases, VMs experience slower boot times, delayed application responses, and reduced transaction throughput. It can also cause CPU idling in wait states, queue buildup, and timeouts in storage-intensive workloads like databases or virtual desktops.
A Storage Area Network (SAN) is a dedicated, high-speed network that provides block-level access to storage, allowing multiple ESXi hosts to share a central pool of storage devices. Unlike Network Attached Storage (NAS) (which uses file-level access), a SAN presents storage to ESXi as raw, unformatted “logical disks,” known as LUNs (Logical Unit Numbers). This structure is ideal for virtualization because it allows high-performance shared access, which is required for features like VMware vMotion and High Availability (HA).
Monitoring tools detect storage issues early by tracking key performance indicators such as IOPS, latency, queue depth, and throughput across hosts and datastores. Modern tools with AIOps capabilities can correlate spikes in latency with workloads, identify path failures or retries, and use thresholds or baselines to alert on abnormal behaviour before it escalates into outages or VM performance degradation.
LUNs hide the complexity of physical disks (RAID groups/spindles) from the ESXi host, presenting a single, manageable logical disk volume.
Unified observability means that eG Enterprise collects metrics and signals from every tier where a problem can arise removing visibility gaps. The AIOps engine is able to automatically process and correlate the data between tiers to provide root-cause diagnostics that pinpoint the cause of issues automatically.
Whilst hardware failures cannot be avoided, adopting an observability solution with the capabilities to continuously monitor storage hardware ensures that these issues are rapidly identified for remediation.
 Karthik Ganesan is a Systems Manager at eG Innovations, he has worked out of our R&D office in Chennai for over 10 years. Karthik started his career as a hands-on network engineer and has particular empathy for those involved in frontline customer support.