The original review was published on David's site:https://wilkyit.com/2018/09/24/monitoring-citrix-cloud-with-eg-innovations/.
Read on to see why David thinks:
Citrix Cloud is becoming mainstream now for many new deployments and there is a push to move existing on-premises solutions to the cloud. At the same time, there is a requirement for organizations to deliver the same level of monitoring cloud services that they have in place for the on-premises solutions.
Large enterprise organizations and system integrators will be looking to understand how they can monitor the Citrix Cloud service to ensure that the service is meeting their expected SLAs. Additionally, they need to determine how issues are detected, routed, and notified to the appropriate IT staff and then acted upon proactively (instead of waiting for user's to inform the service desks about these issues).
What monitoring do you get with Citrix Cloud?
- Citrix Service Health Dashboard - https://status.cloud.com provides status updates of Citrix cloud service (overall) with notification via different methods. They are as follows:
- Email
- SMS
- Slack
- WebHooks
- Microsoft Teams
- Citrix Director is included with Citrix Cloud
- Notifications
Citrix Service Health Dashboard
The Citrix Service Health dashboard provides a traffic light view of the different services that are part of the cloud service. (Citrix Cloud, Virtual Apps & Desktops, Content Collaboration, Endpoint Management, Secure Browsing & Licensing Usage)
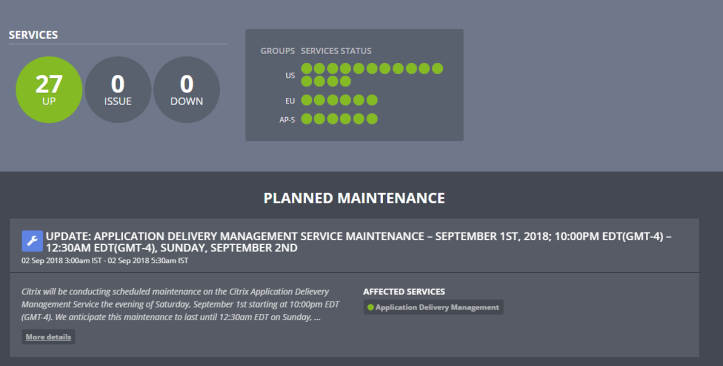
NOTE: Not all services are replicated for each region
When you scroll further on this page, the service history is displayed for the past week.
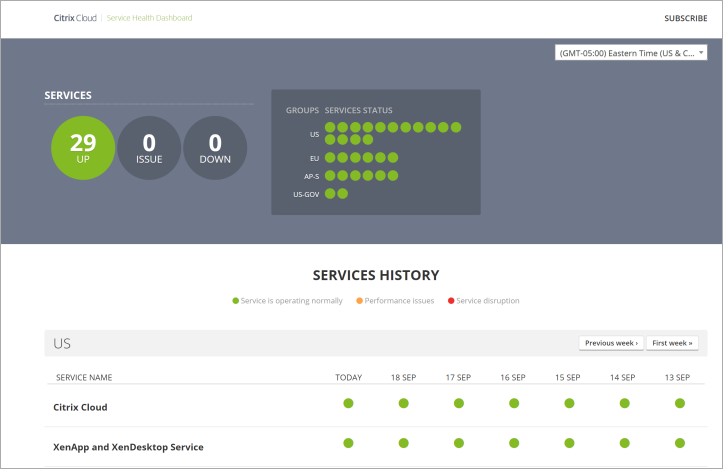
Clicking subscribe at the top right of webpage will allow you to receive notifications.
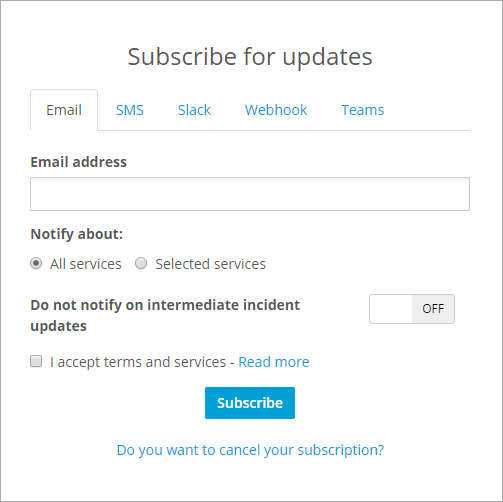
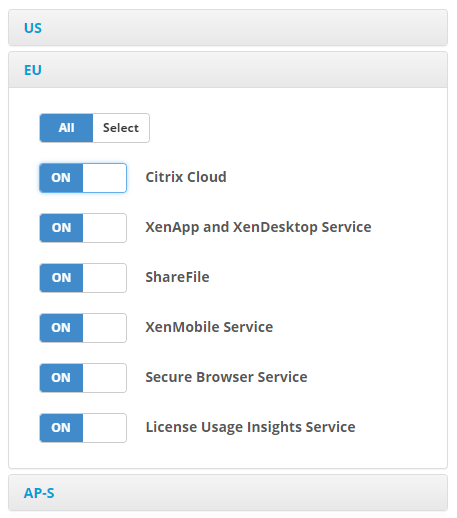
These updates can be selected per region, and then, further by service, as indicated in the screenshot below.
 Notifications
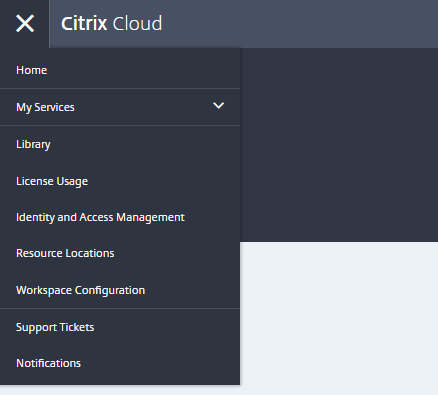
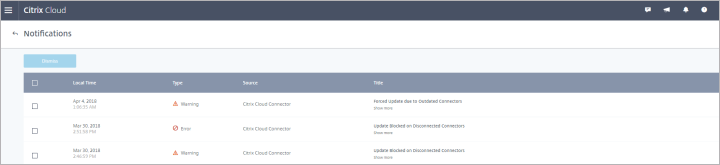
Notifications are available within Citrix Cloud. Access to notification is via the hamburger menu, Notifications (bottom of menu), Selecting Notifications.
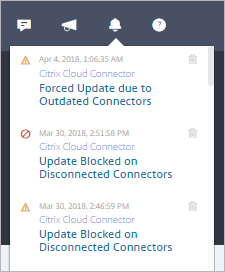
This will display Warning, Error & Informational messages. The example below shows a Cloud Connector that has not been switched on for a while and is outdated.
Another way to access notification is the bell logo at the top right icon menu on Citrix Cloud menu.
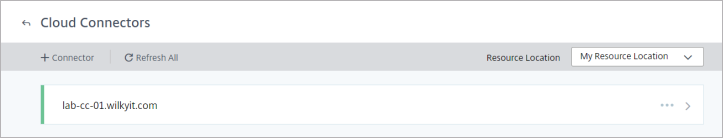
Citrix Cloud Connector Health Status
Citrix Cloud offers the ability to check the health status of the Cloud Connectors. This is accessible by browsing the hamburger menu: Click Resource Location and then click the Cloud Connectors. This is listed by Resource locations.
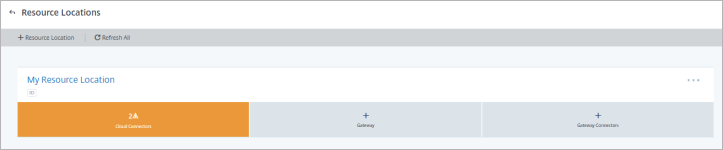
Click the arrow to expand the health check information on the Cloud Connector (Note: the green left-hand border indicates a good health status).
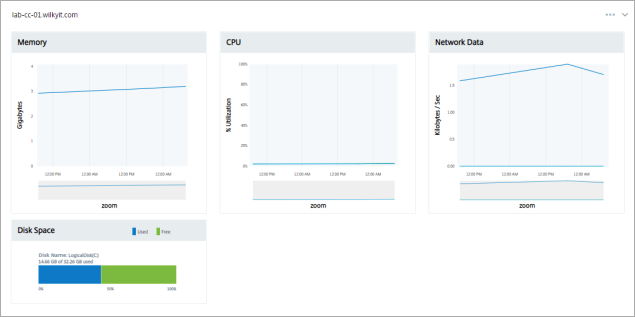
Further detail on the Cloud Connector(s), such as Memory, CPU, Network Data & Disk Space, is also available.
Unfortunately, Citrix has not provided a Management Pack for any of its Citrix Cloud services. The Citrix Cloud Connector is a major component that is hosted within customer environments/resource locations. This is likely due to the announcement in this article with the recommendation to move to Citrix Ready Partner that provides monitoring and reporting services. This brings us to the next section of the article. As a Citrix Ready partner, eG Innovations has added monitoring capabilities for Citrix Cloud in its eG Enterprise solution.
Using eG Innovations to Monitor Citrix Cloud
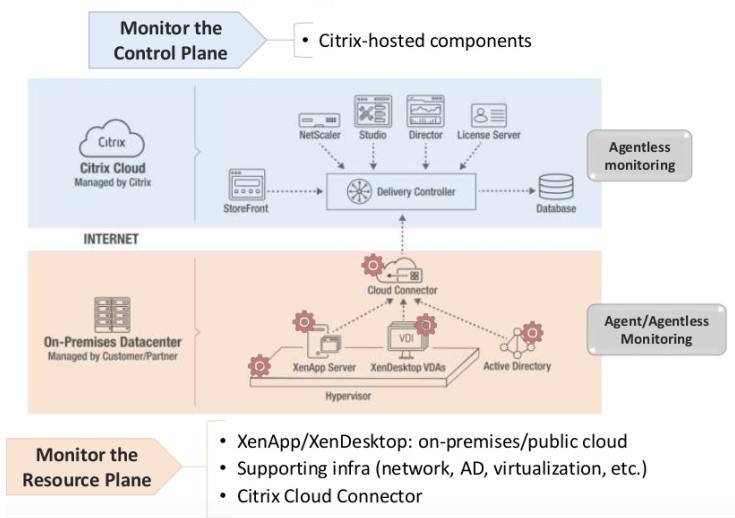
eG Enterprise from eG Innovations is an end-to-end Citrix monitoring and analytics tool that provides native support to monitor critical Citrix Cloud components, such as the Cloud Delivery Controller, and the Citrix Cloud Connector and the resource plane components, including the XenApp servers, XenDesktop VMs, hypervisor, AD, etc. Monitoring of the control plane leverages Citrix Cloud APIs. With eG Enterprise, you can:
- Track dependencies between the control plane and resource plane
- View the entire Citrix delivery topology from a single pane of glass and auto-correlate performance alerts
- Easily pinpoint whether a problem originates in the control plane infrastructure, connectivity to the cloud, or in the resource plane
- Monitor the availability and functioning of the Citrix Cloud Connectors
The eG Enterprise solution is made up of two components:
- Agent
- Monitoring Platform
eG Enterprise comes in two deployment models: an on-premises deployment and a fully SaaS-based service. For the purpose of this article, the SaaS based "eG Enterprise Cloud solution" has been used. Let's look at the various aspects in which eG Enterprise provides monitoring for Citrix Cloud.
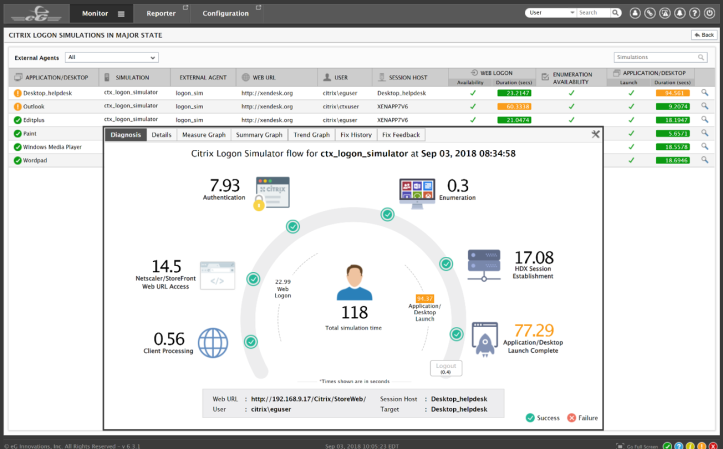
The eG Enterprise Citrix Logon Simulator
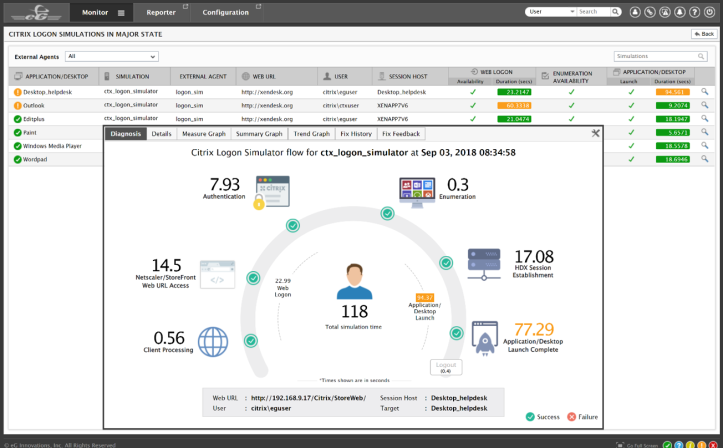
The first aspect of monitoring Citrix Cloud using eG Enterprise is with the built-in Citrix logon simulator. This is a synthetic simulation tool that runs externally and checks logon performance and application/desktop availability for Citrix Cloud services. You can use the logon simulator to get alerted to logon issues proactively well before real users start complaining of logon slowness and connectivity issues. The synthetic test results of the logon simulator can also be used to baseline logon performance at various times and from various locations. A free version of the logon simulator is also available: https://www.eginnovations.com/citrix-free-logon-simulator
Monitoring the Cloud Connector
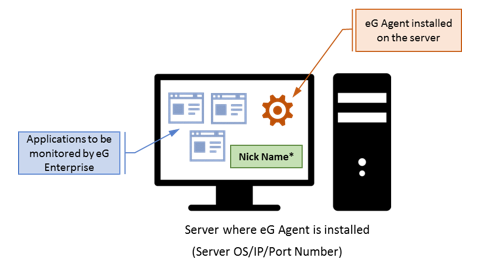
This is the component I used eG Enterprise to monitor to test its Citrix Cloud monitoring capabilities. The Cloud Connector is running on a Windows box on the resource plane. To monitor the Cloud Connector, eG Enterprise requires a lightweight eG Agent to be installed on the Windows Server running the Cloud Connector. This Agent collects all the performance metrics about the Cloud Connector connectivity, processes, services, resource usage, and so on.
Installing the eG Agent
Installing the eG Agent is simple and can be done in a few steps.
- Download the eGAgent_win2012_x64.exe , provided by eG Innovations (ignore the agent name referring only to win2012)
- Windows 2012 R2/2016 Server where the cloud connectors are installed
- eG Manager IP Address/Port
- HostName : egontap.eginnovations.com
- SSL Port : 443
- Trust all certificates
Overview of eG Enterprise Monitoring Console
The eG Agent talks to the cloud-hosted eG Enterprise monitoring console which can be accessed over the web (HTTP/S). The following gives an overview of eG Enterprise monitoring console's user interface. There are 4 tabs on the console.
 Admin
Admin
Go to Configure Specific Test, selection. Here you will be able to configure the monitoring (e.g., specifying username and password to connect to Citrix Cloud). You can also Include/Exclude additional tests for monitoring if necessary.
Monitor
Pre-built monitoring models are available to track the health, availability, and performance of components. Dashboards are broken down into layers. A layer model representation simplifies monitoring because metrics are categorized and grouped by layer, which makes it easy to identify where a problem exists. You will see more of this when we look at a component monitored by eG Enterprise.
Reporter
Here you can see KPI reports, system performance, historical analytics, trending, forecasting, etc.
Configuration
This menu provides a view of a system's current configuration. You can also track changes in configuration of servers where the eG Agents are deployed.
Accessing the eG Enterprise Cloud Solution
Step 1: Access URL http://egontap.eginnovations.com/
Step 2: After successfully logging in, you will be presented with an Alarm pop-up. Because we have not yet configured monitoring and alerting, the alarm window was blank. As this is the initial setup, please close and ignore this page.
Step 3: The main console loads with "No components have been enabled for monitoring".
Step 4: After completing a Deployment Questionnaire from eG Innovations support team, which asks for details such as:
- Name of platform you will monitor
- Server OS Version
- IP Address
- Port
- Nick Name* (in my case, I have used hostname)
you can proceed to configure the monitoring in the "Admin" menu.
*Nick Name is the unique identifier you create for each server where you install the eG Agent
Step 5: The monitoring menu now displays the component(s) that have been configured for monitoring.
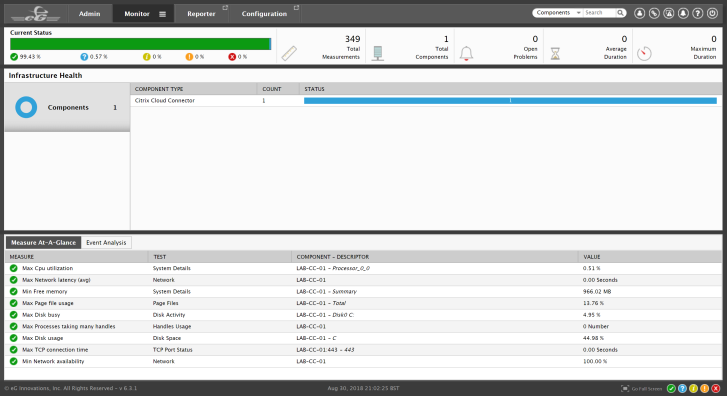
Clicking the Citrix component of your choice, you can drill down to access the performance metrics for that component. Here I am monitoring my Citrix Cloud Connector and I clicked on it.
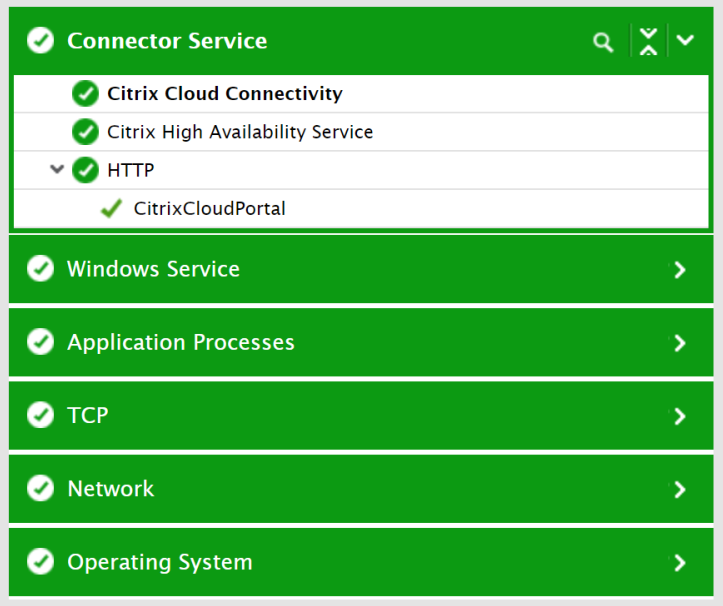
Layer Model View
In this view, you can see that metrics are groups under different layers for easy problem detection.
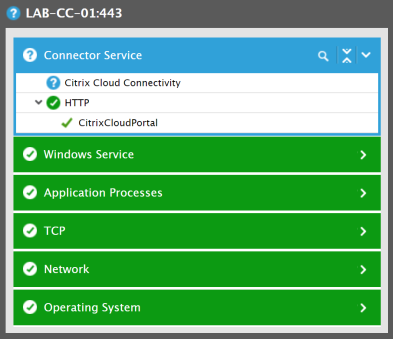
NOTE: Blue section highlighted has not been configured as of now but will be configured later.
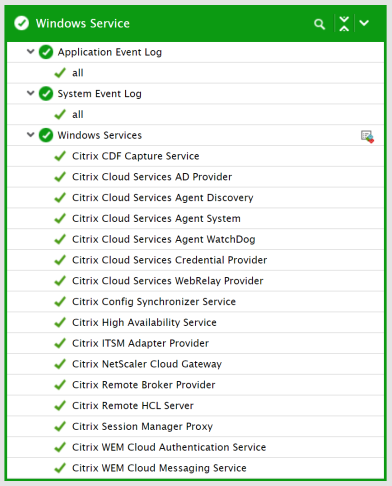
Windows Service, any application/system event log status for the core Windows Services required for Citrix Cloud Connector.
Application processes and any application/system event logs status for the core Application processes required for Citrix Cloud Connector are displayed.
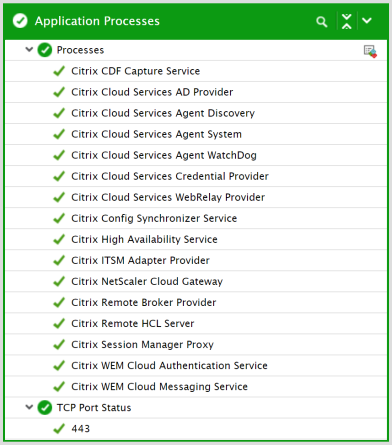
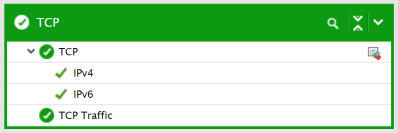
TCP status for the System Hosting the Citrix Cloud Connector
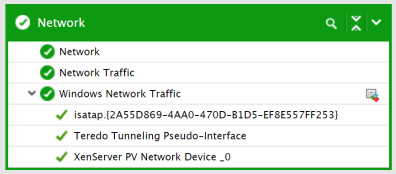
Network status for the Citrix Cloud Connector system
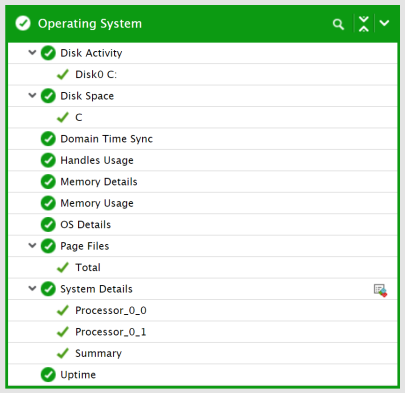
Operating System status for the Citrix Cloud Connector
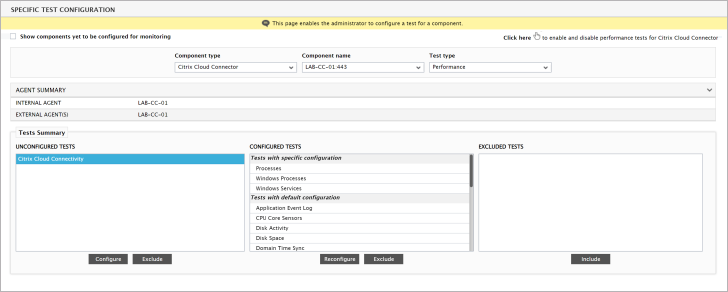
eG Enterprise checks if the Citrix Cloud control plane is accessible from the cloud connector. To configure this monitoring, click Admin > Under Test Summary >click Citrix Cloud Connectivity > and then Configure
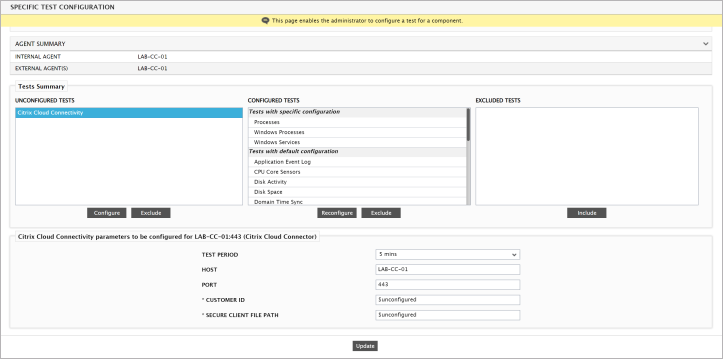
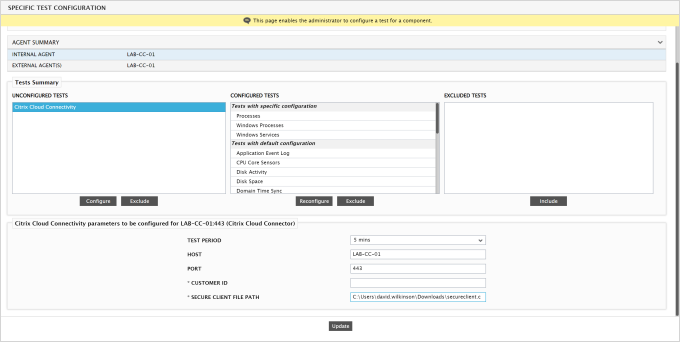
Enter the Customer ID & Secure Client File Path.
- Customer ID can be found on the Citrix Cloud portal > Hamburger Menu > Identity and Access Management > API Access.
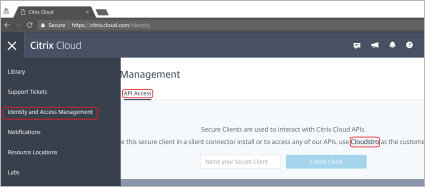
- Secure Client file -> Clicking Create Client on the same page and giving a descriptive name will allow you to create the secure client file. A download of secureclient.csv will then begin.
NOTE: File path should be copied to C:\egurkha\lib (ie.C:\egurkha\lib\secureclient.csv)
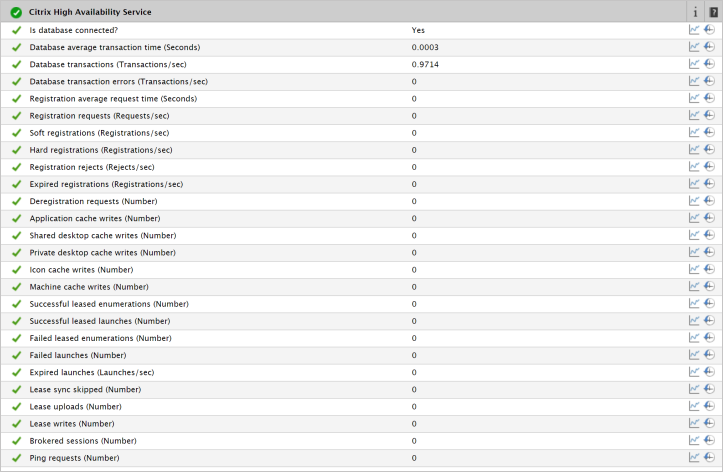
Connector Service has now turned green and Citrix Cloud Connectivity and Citrix High Availability Service Statistics are now available.
Drilling down further into the Citrix Cloud Connectivity/Citrix High Availability Service links you'll see a lot of additional performance metrics and information that would not necessarily be available through Citrix Director.
Monitoring the Resource Plane
In addition to monitoring the Cloud Connector, eG Enterprise provides deep visibility of the other resource plane components, including XenApp servers, XenDesktop VMs, hypervisors (VMware, Hyper-V, XenServer, Nutanix, etc.), Active Directory, storage and network devices, and so on. Similar to the layer model available for the Cloud Connector, there are pre-built monitoring models available for every component monitored by eG Enterprise.
I am specifically targeting the Citrix Cloud Connector and Citrix Control Plane in this blog as other articles by George Spiers and Rory Monaghan exist on the wider platform that discuss eG Enterprise's monitoring capabilities, such as user sessions, application performance, and hypervisor monitoring, etc.
Monitoring the Control Plane
eG Enterprise leverages Citrix APIs to monitor the Cloud Delivery Controller. A built-in monitoring model for this component delivers analytics including Delivery Groups, Machine Catalogs, machine registration state, session state, power state, resource usage, load evaluator index, zone details, site details, and more. Without having to deploy any agent in the control plane, these metrics can be obtained.
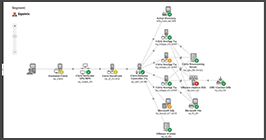
Topology View
For the purpose of this document, we have covered only the Citrix Cloud Connector. A full Citrix delivery topology view will appear when additional elements/components, such as the Citrix control plane components and the resource plane XenApp servers, XenDesktop VMs, hypervisors, Active Directory servers, etc., have been added to monitor.
Topology view provides a full end-to-end view (single pane of glass) of the Citrix Cloud service, including all the backend services, Cloud Connector, Cloud Delivery Controllers, etc.
Non-Citrix Cloud Control plane Monitoring
I strongly advise you visit several other blogs by fellow Citrix community members that cover the non-cloud side of things (which I have not gone into great details about):
Additionally, eG Innovations offers a free Citrix logon simulator, which synthetically measures the time taken for every step in the Citrix Virtual Apps & Desktops logon process. This can be a useful utility to test logon performance and application availability for the Citrix Cloud service and to proactively catch issues.

Conclusion
Overall, eG Enterprise from eG Innovations is a great product that clearly identifies and covers gaps in Citrix Cloud monitoring. It has already built a great reputation in the Citrix community for the granularity at which it can help monitor and diagnose common deployment and performance problems to quickly improve end-user experience. Because eG Enterprise provides end-to-end monitoring across Citrix components and the supporting infrastructures, Citrix admins can now say "It's not Citrix. It's a problem!" This will put a smile on their faces after years of everything being blamed on Citrix.
Learn more about eG Enterprise:www.eginnovations.com/Citrix
Get a free trial of eG Enterprise: www.eginnovations.com/FreeTrial