eG Enterprise is a popular Citrix monitoring tool of choice for many organizations across the globe. In this article, Matthias Schlimm discusses how eG Enterprise was installed for a large Citrix customer with over 10,000 end users and reviews how the product was used to solve their Citrix performance challenges. The original article was published on CUGC site: https://blogs.mycugc.org/2017/11/14/citrix-monitoring-using-eg-innovations-for-an-enterprise-customer/.
In this article, you will see how a case study of how we successfully set up Citrix monitoring in a large customer environment. In the last few months, we were jointly working with the eG Innovations team, to deploy eG Enterprise Citrix performance monitoring suite for a large customer.
In this case, the customer has a daily minimum of 11.000 CCU XenApp sessions across the globe. Here is some information about the customer environment:
| Component |
Numbers to be monitored |
| XenApp 6.5 / XenApp 7.x |
~800 |
| Citrix XenServer |
~180 |
| Citrix PVS |
6 |
| Citrix StoreFront |
2 |
| Citrix Delivery Collector |
6 |
| Citrix Director |
2 |
| Citrix NetScaler |
6 |
| Citrix ZDC |
4 |
| Citrix Logon Simulator |
3 |
| Citrix Storage Zone Controller |
2 |
Before we started the project, eG Enterprise provided us with very good calculations for database requirements, DB size, IOPS, RAM and CPU for the SQL Server — which was helpful to speed up the installation process.
Once we got through the product deployment and set up monitoring of the above-mentioned IT components, the dashboards in eG Enterprise provided us with a quick overview of the entire IT infrastructure. We could also see the Citrix logon count, and the logon time from the built-in Citrix logon simulator on the same dashboard.
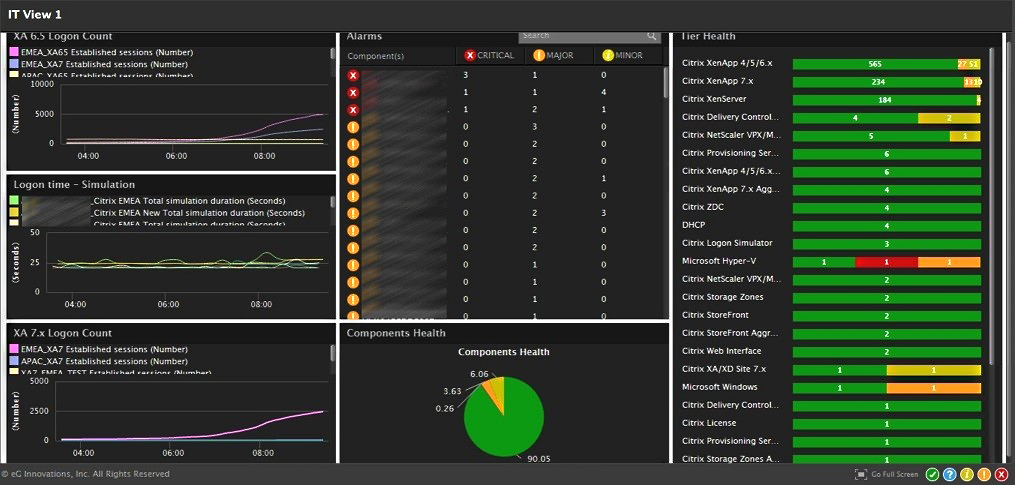
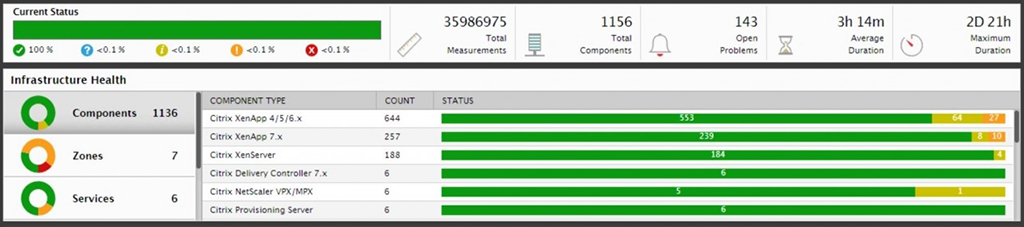
On the Infrastructure Health Overview dashboard, you can find different levels of drilldown, such as Components, Zones, Services, Segments, and Aggregates. This allows you to click and open either a monitoring dashboard for a specific component, or view a service topology map, and so on.
Aggregation, particularly, deserves a mention here because I think it is a very cool feature. Let's say there are 5 XenApp servers and we want to monitor CPU utilization of all 5 servers as an aggregate, and not individually. The aggregation feature in eG Enterprise allows us to do that easily by providing an aggregated overview of a specified performance metric across all 5 XenApps servers. If you are monitoring some servers as a cluster, this feature will be quite useful.
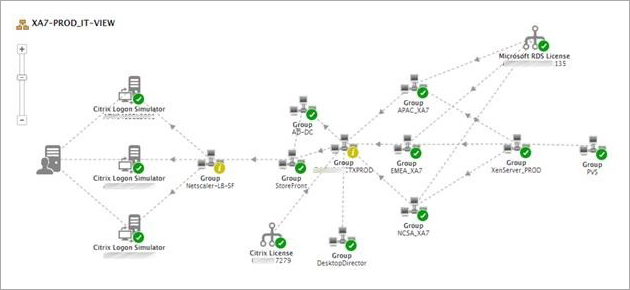
In the Segments view, we have created a topology of the infrastructure to see the communication flow in the customer's environment. This topology view not only allows us to view dependencies and relationships between the various components, the color-coded alert status also provides clear indication of where a problem is. This helps us infer how a problem, say an error or warning or critical alert, in one component impacts the performance of other IT tiers.
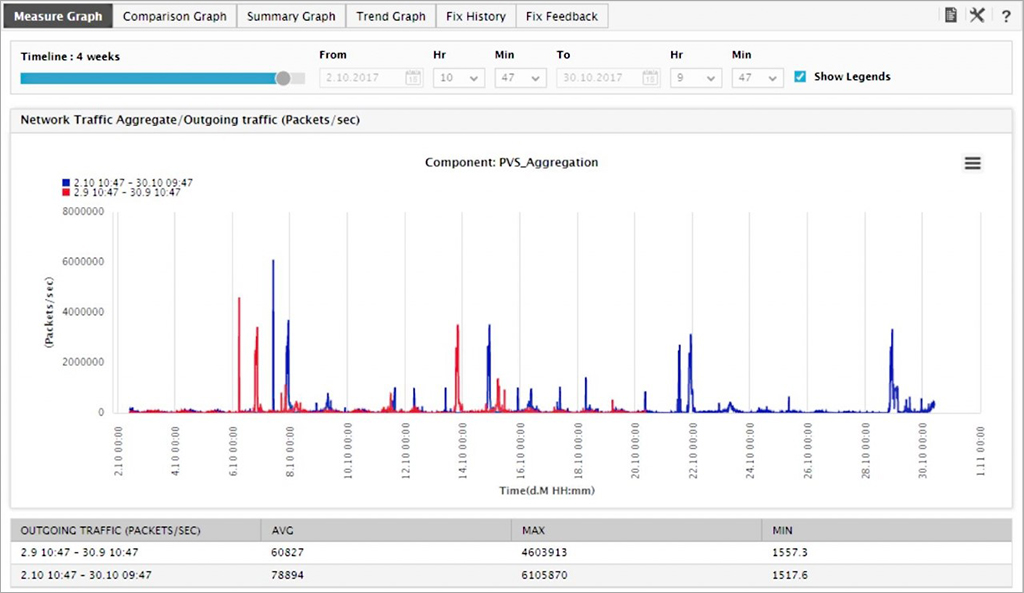
When the lookback functionality is enabled, we can compare the metrics over time (for example, in the last 4 weeks). This becomes very useful to compare a specific metric in a given day or week with a reference point in the past.
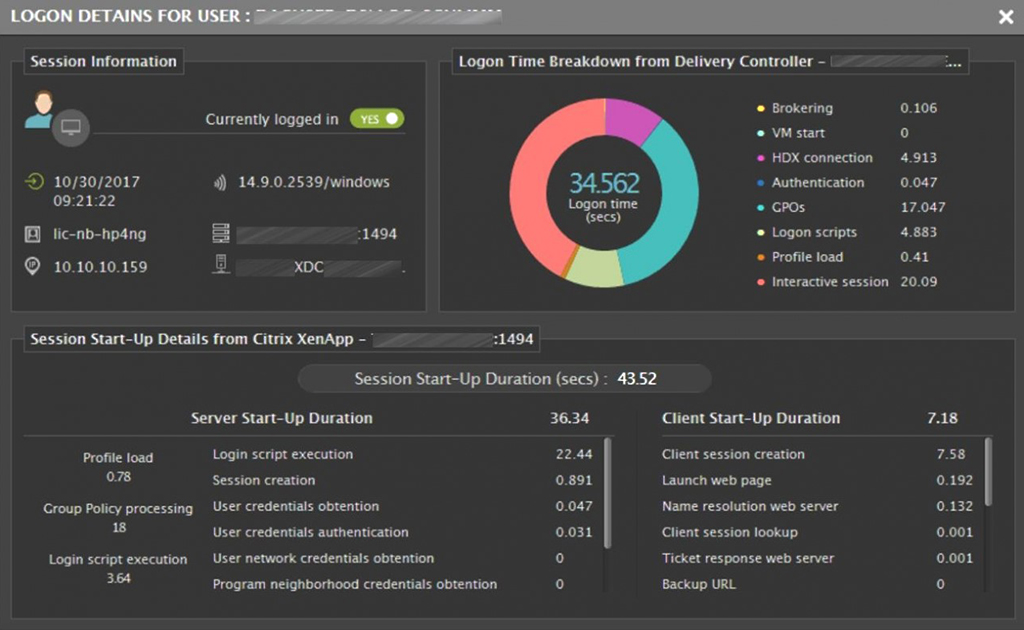
eG Enterprise provides out-of-the-box Citrix user experience monitoring dashboards that allow you to get real-time visibility of user experience metrics, such as logon time, screen refresh latency, HDX bandwidths, disconnects, etc., for XenApp and XenDesktop sessions.
Drilling down into user logon information, we get to the Logon Details screen that provides deep-dive visibility of logon time execution. We can see the time taken for every step of the logon process and easily pinpoint which step is causing slowness — is it due to slow brokering, or logon script execution, or profile loading, or is any of the Client-Side Extensions in Group Policy processing taking more time?
For monitoring XenApp and XenDesktop infrastructures, eG Enterprise offers two types of licensing:
By the number of XenApp Servers or the number of hypervisor hosts running virtual desktops
By the number of Citrix user sessions
A customer can choose either server-based licensing or user-based licensing according to their custom needs.
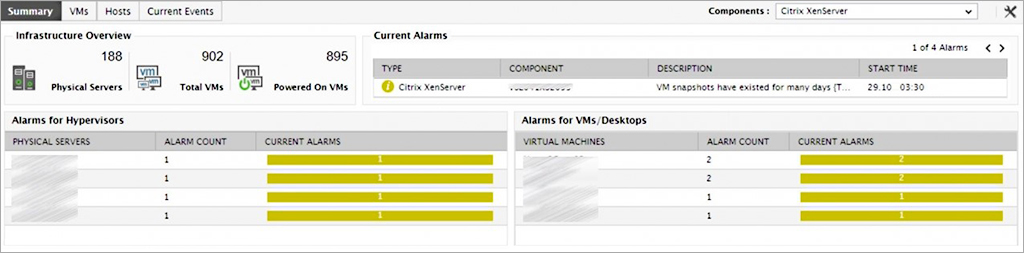
XenServer and NetScaler Monitoring
eG Enterprise also does monitoring of XenServer and NetScaler. Since an agent cannot be directly deployed on the NetScaler appliance, eG Enterprise uses a Remote Agent installed in a separate VM/desktop to collect performance metrics. It is to be noted that the Remote Agent does not consume any license.
For each hardware enclosure with 16 XenServers, we are setting up 1 eG Remote Agent. In summary, we install 12 eG Remote Agents. As per eG Enterprise's technical specifications we can configure 25-30 components per each eG Remote Agent. XenServer monitoring is very useful to go deeper into the hypervisor environment and get all the needed metrics – both from an outside view and inside view perspective of virtual machines.
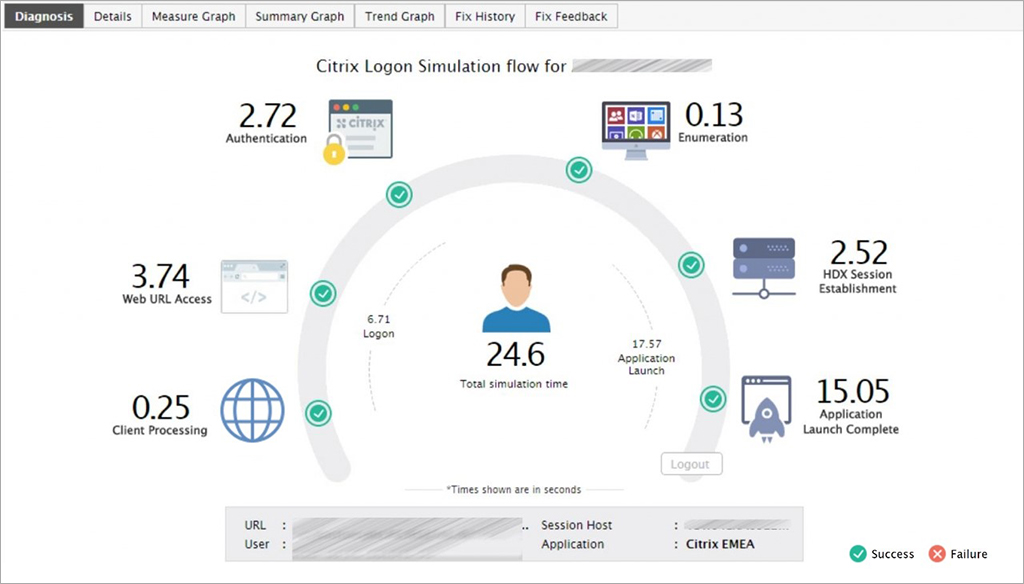
Citrix Logon Simulator
eG Enterprise includes a built-in Citrix Logon Simulator. It is used for synthetically simulating and proactively testing user logon scenarios: browser access, connection to StoreFront, authentication, enumeration, application/desktop availability and launch. We are setting up 3 Logon Simulators at the moment: 1 at each of our datacenters and 1 in a remote location, where also the Zone in Citrix XenDesktop is configured.
The Logon Simulator shows exactly how long each step of the logon process takes for execution, and also captures failures. Prompt e-mail alerts help us get notified of issues immediately.
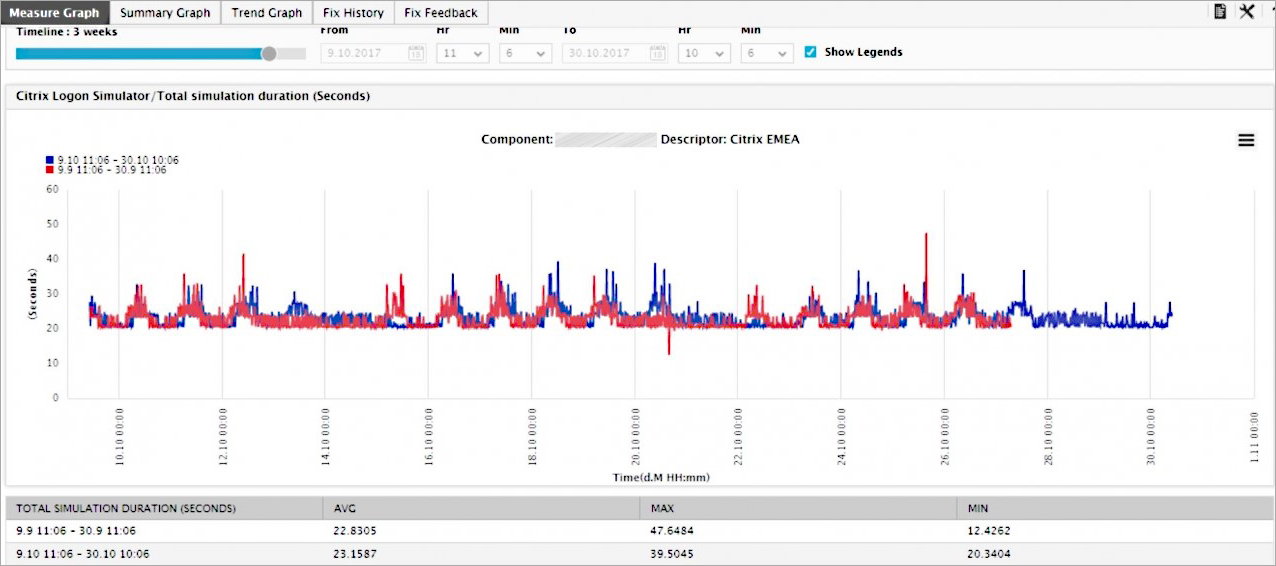
We can also compare the complete logon time metrics with historical reference points, using the lookback function which we discussed earlier. In my opinion, this lookback feature is very useful for administrators.
Real World Example
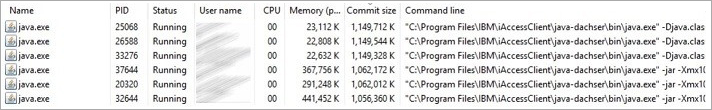
Towards the end of October 2017, we received an email notification from eG Enterprise stating that "Committed Memory on your server is full." We looked into the Task Manager first and noticed that we had free memory of 25%. On further analysis, we found that, the server was running with 11 users at that moment, and each user had 2 Java processes running, with Java committing 22 GB. We did receive a complaint from an end-user after a few minutes reporting he is not able to work but using eG Enterprise we found the issue much before the user complained.
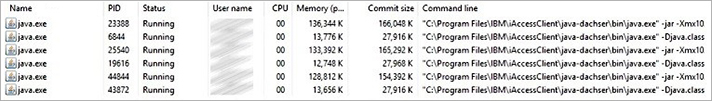
After running some tests, we saw that this application was using an incorrect Java version. Once we fixed that issue, the committed memory automatically reduced, as you can see below. In about three hours, we were able to fix this issue and reboot the XenApp Servers overnight to get the updated vDisk image.
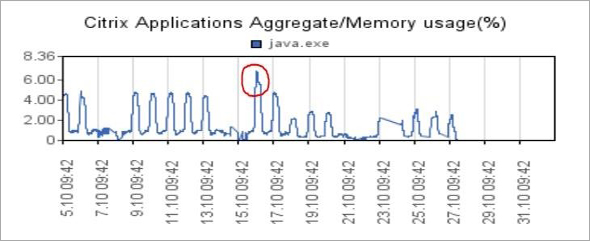
With the Reporting Module of eG Enterprise, we create and schedule a report for the last four weeks to see the metrics of the specified process java.exe (the red marked is the issue that we described).

Conclusion
eG Enterprise is a very useful and flexible performance monitoring solution. If we identify a bug, we receive a bug fix, mostly, in the next 72 hours. You can customize the product as needed, depending on your environment. It is possible to filter out the mail notifications, so that you only receive the alerts that you need. Also, the thresholds can be customized by overriding the default values.
Last but not the least, using eG Enterprise, our customer is now able to monitor and report on their environment, and additionally benefit from baselining, migration reports, Citrix-specific reports, and management overview reports.