
About the AuthorRory Monaghan is an EUC expert having over 12 years of experience in Microsoft, Citrix and VMware solutions. He is a CUGC Leader and has been certified as a Citrix CTP, CTA, Microsoft MVP, VMware vExpert and VMware EUC Champion.
Product Review by Rory Monaghan
Here is a product review of eG Enterprise by Rory Monaghan. The original review was published on Rory's site: https://www.rorymon.com/blog/review-eg-enterprise/.
A few years ago, I started on a new project. I had thought I was stepping into a Citrix XenApp 7.6 migration at its very beginning. It turned out the project had already been underway for some time and had a few false starts. The environment was fraught with performance issues, as well as with several nasty bugs in the early unpatched version of 7.6. One of which, was particularly frustrating. Zombie Session which I blogged about here.
I have told others, I tend to learn more about products when starting after the implementation is already underway. I am forced to try and reverse engineer an undocumented, unmitigated disaster.
One of the biggest hurdles was the fact our only real data source and monitoring solution was Citrix Director. We quickly discovered it wasn't providing us with a wide enough view of the environment. We were forced to spend days and weeks trying to discover the root cause for performance issues.
For these reasons, I have spent considerable time over the last year learning about the different monitoring and analytics tools on the market. One important feature I am looking for in a product is not just monitoring of the Citrix infrastructure components themselves but also a view of the underlying infrastructure that Citrix sits on. I was happy to learn that eG Enterprise from eG Innovations provides just that.
Note: You could use these products with your Omnissa Horizon environment too but for this post, I focus on using it for a Citrix environment.
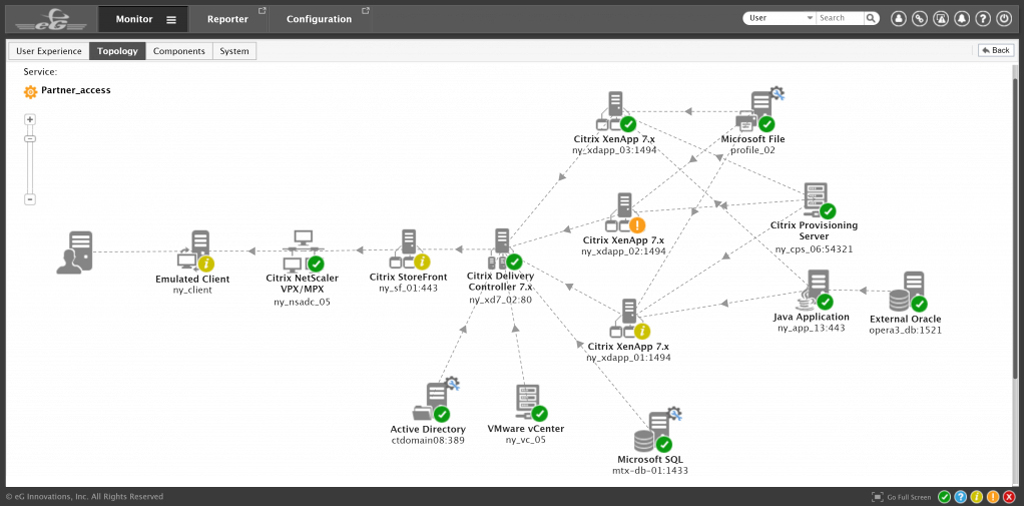
There's a great topology view. I have seen this in other products too, but mileage may vary depending on the product. Some require you to map things out for yourself to create the view, not here. If you have performance issues, you can go right here and get a high-level view to see where a choke point may be. On the topology map, you can see the dependencies between the Citrix infrastructure with the supporting infrastructure – network, storage, virtualization, AD, database, etc.
eG Enterprise also automatically detects if the XenApp server is running on a virtual machine and presents a virtual topology highlighting the dependencies between the VM and the host. In this example, you can see that there are two XenApp servers and a SQL Server running on a VMware ESX host.
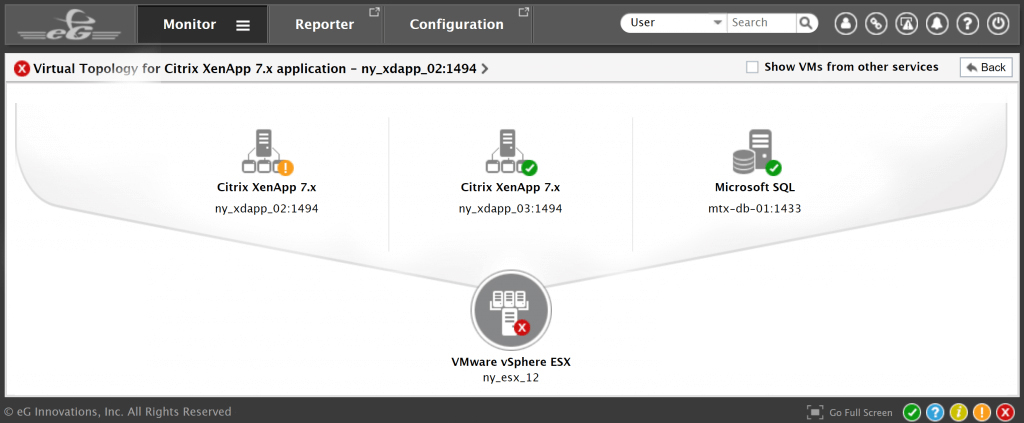
Obviously, the topology maps show color coded with the basic Red, Amber and Green. If something is red, it really needs attention and is likely the source of issues in your enterprise. In this case, the hypervisor has a critical alert, which indicates that the XenApp server performance issue could be due to a virtualization bottleneck.
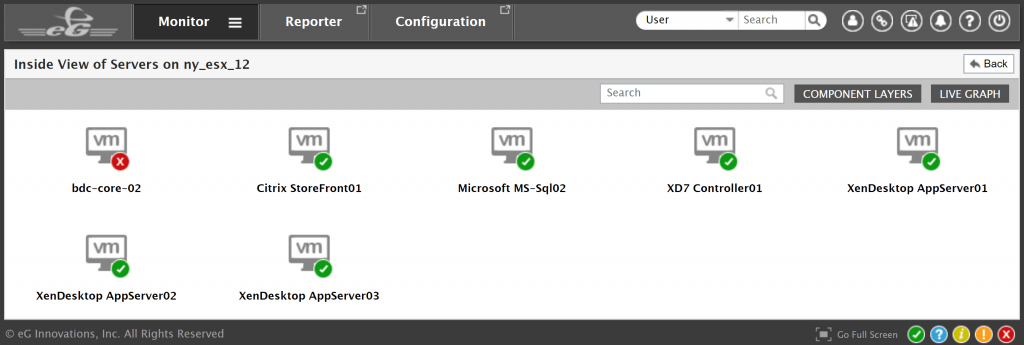
Here we can see a perfect example of this. I can see a virtual server on a host showing red.
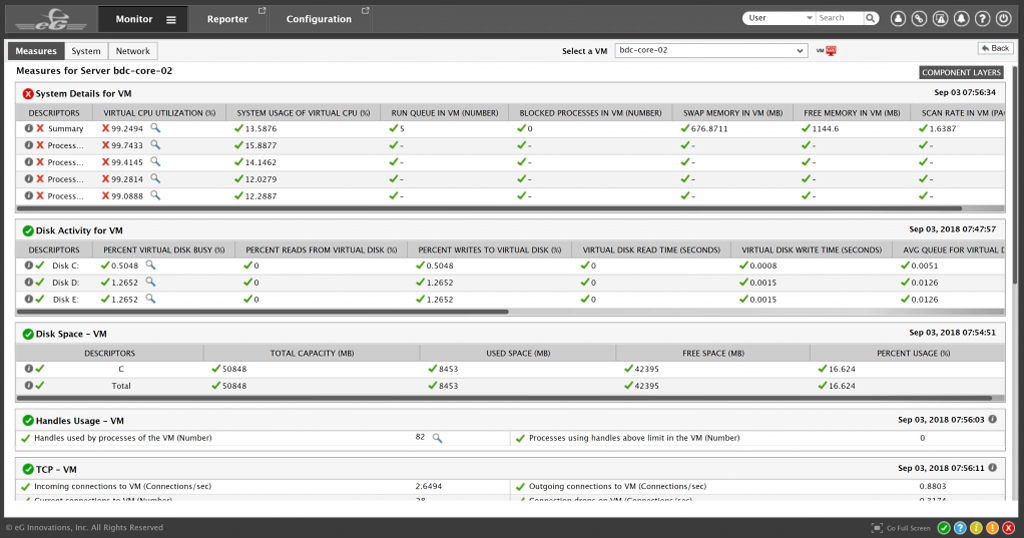
When I drill down, I see the virtual server is getting absolutely rocked on CPU Utilization.
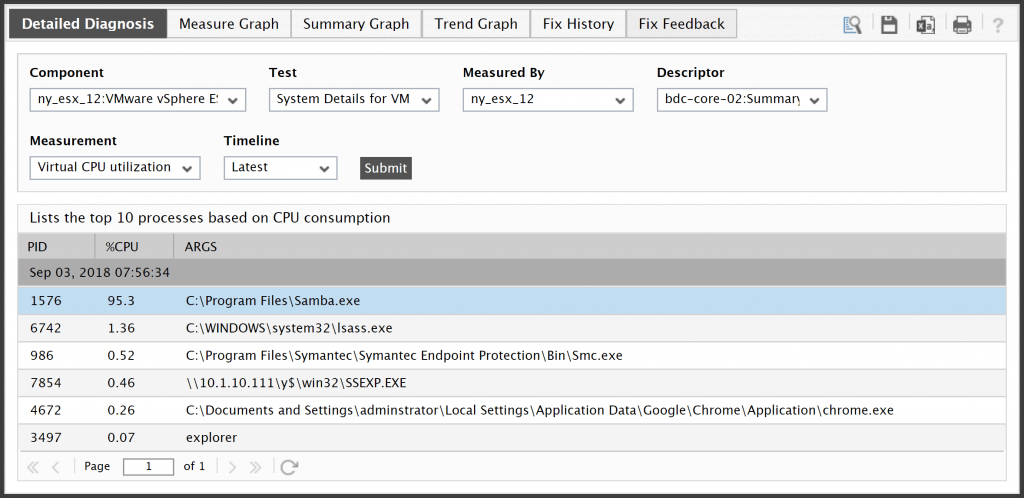
When drilling further we can clearly see that one process is heavily draining resources. This process happens to be a backup utility. An interesting example, as just a couple of weeks ago during a change window, the change was backed out after discovering the application server was on shared storage which was crippled during backups.
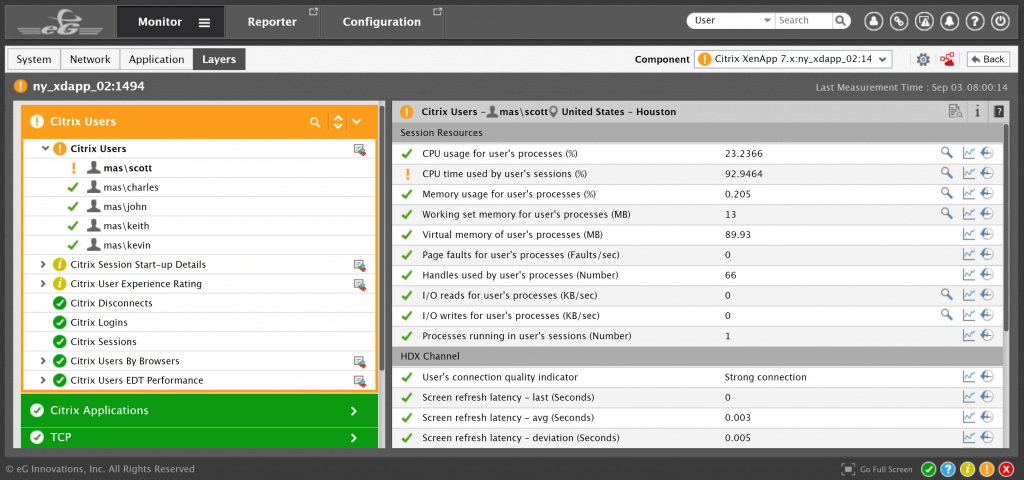
We can also get a user level view. In the above example, we can see a lot of detail around the end user experience. You can set your own baseline and thresholds to highlight when a user is experiencing a substandard experience for your environment. A comparison of screen refresh latency and network latency side by side helps identify if it's a server-side issue or a network connectivity problem.

You can drill down into user info and look at a specific measurement. For example, here I am looking at Keith's session info and, in particular, Group Policy processing slowness. You can see it breaks down processing time for each policy applied. Historical information of GPO breakdowns can also be seen readily on the monitoring console. Pretty powerful info!

You can also get performance metrics at the application level and drill down into this info. You've got application level, user level, infrastructure all tied together in a single console.
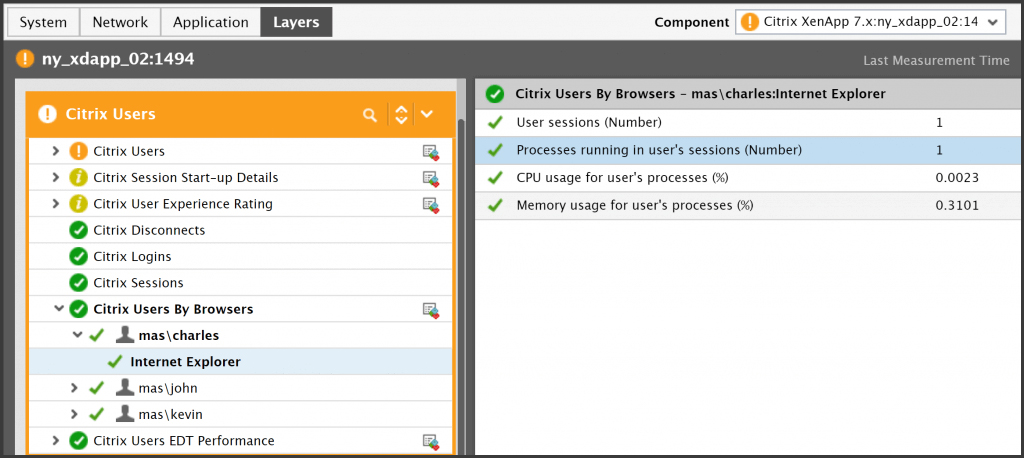
Get this, not only can you look at specific applications but also web usage!
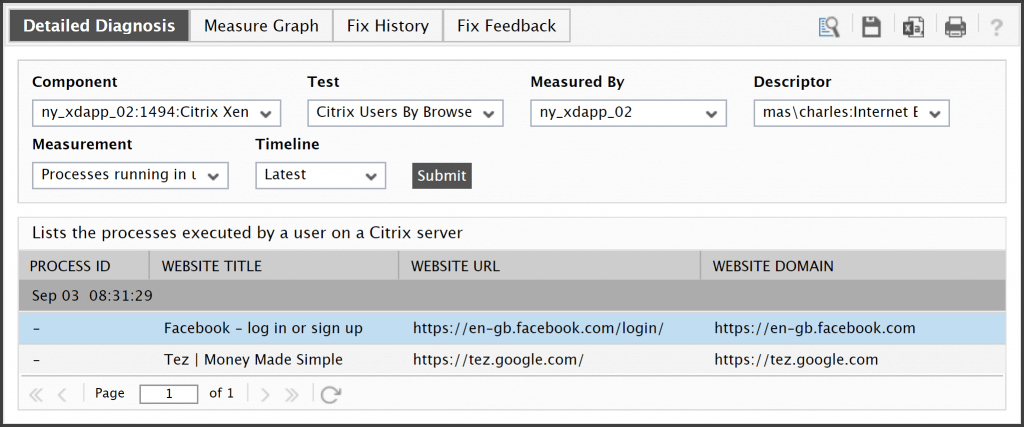
Above you can see I have drilled into Charles's Internet Explorer usage and can see he is accessing Facebook. Bad Charles!
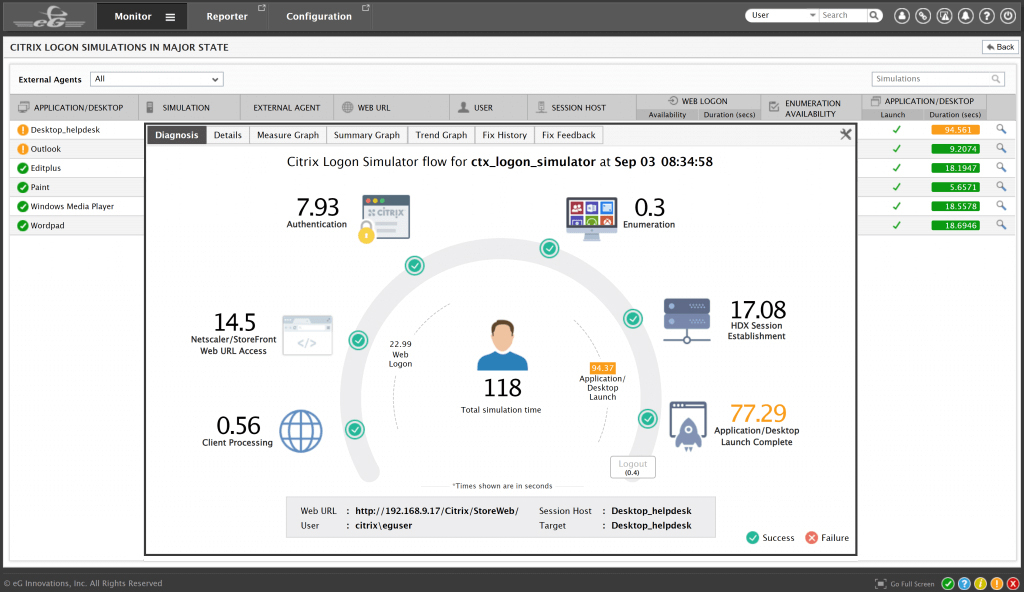
Whenever I see eG Enterprise mentioned online, I usually see the screen above. This is from the Logon Simulator. You can see data displayed for a simulated logon with some of the steps of the logon displayed. You can also drill into the info from here to get similar views and data as shown above in this article.
Logon simulators have become very popular. If you have multiple datacenters, this could be a perfect fit to put some of your idle resources to use. By generating a load in your environment, you can test against newly installed patches or changes in your environment or possibly detect anomalies as they occur.
eG Innovations also offers a free version of the logon simulator, which is fully SaaS-based. If you'd like to try it, visit www.eginnovations.com/express.

I am very impressed by eG Innovations' products. I am of the belief that you really need several layers of visibility and monitoring to be truly successful with your virtual environment. eG Enterprise provides several of these layers.
It may seem insignificant to some but compared to competing products, the visuals of these products really standout. If you spend a lot of time in a product, the visual does make a difference and probably more importantly, it helps convince management.
If you want application level data, you got it. If you want to detect web usage, you got it. If you want to detect user idle time or activity, you got it. If you want to detect infrastructure issues, you got it. You get so much data, so many levels that I'd be surprised if there's a scenario you've run into that this product couldn't help with.
If you would like to learn more about eG Enterprise: www.eginnovations.com/Citrix.
You can also get a free trial access to the product and explore the capabilities yourself.