End user experience is instrumental to digital workspace success. The performance of a virtual app or desktop session is as good as the experience perceived by the user. When a user complains of slow logon, high latency, slow app launch, disconnects, etc., it becomes challenging for Citrix administration teams to validate the problem, look for the root cause, and then engage in troubleshooting.
eG Enterprise version 7 has introduced ground-breaking capabilities to help Citrix admins monitor, detect, diagnose, and troubleshoot end user experience issues faster than ever before. We invited George Spiers to review eG Enterprise v7 and comment on its Citrix Workspace monitoring capabilities.
The original review was published on George's site:https://www.jgspiers.com/review-of-eg-enterprise-v7-end-to-end-monitoring-for-citrix-workspace/.
Read on to see why George thinks:
eG Enterprise from eG Innovations, a Global Technology Partner for Citrix, is an end-to-end monitoring solution that, amongst many other technology products, monitors the Citrix Virtual Apps and Desktops stack of components, including the underlying storage, hypervisors, and network.
Last year I had a look at the 6.3 version of the product. Now, eG Innovations has released their latest version, eG Enterprise v7.
I wanted to take another look at the product as a whole and investigate what is new and improved where it relates to Citrix Virtual Apps and Desktops monitoring.
Organisations that run deployments of Citrix Virtual Apps and Desktops want to make sure that their users receive the best experience possible. A great user experience in relation to this is fast application and desktop launch times, fast logons, a responsive system, and one that rarely encounters any errors. Take these experience factors and think about how users expect to have them wherever they work from and from whatever device they work on.
This is a challenge for Citrix administrators mostly because the end user no longer works from one device or from the same office. The office today consists of multiple devices and multiple locations, often outside of the organisation's control.
This is why monitoring products like eG Enterprise have focused their product updates around helping with these challenges. The information and data you receive from the product aid you in the efforts you make to ensure that your users receive the best experience possible when they interact with published applications and desktops.
Simplified Installation Process
The first thing you will come across is the installation process. You could say it is broken up into three sections:
- Install the product
- Provide database information
- Provide license file
The process is simplified. After installing the product, you specify database information like your database server name, port, database name, and credentials. There is also a new validation feature that allows you to validate the database configuration before proceeding. Previously this was not possible, and if anything was incorrect, the installer would proceed but the install would then fail if the configuration was incorrect, prompting you to start again.
During the installation configuration process, you also can configure eG Manager settings, such as the password complexity for logon accounts and your SMTP details. Previously this was only configurable after installation.
When it comes to uploading your license file, you can use the upload feature of the wizard rather than having to copy the file manually to a directory as per the previous version.
Logon Simulator Screenshots
Logon Simulator is a synthetic monitoring tool that launches connections to applications and desktops during defined times of the day. The Logon Simulator simulates a real user logging on to StoreFront directly or through Citrix Gateway and launching an application or desktop. This is all powered by the lightweight eG Agent, which can run on a virtual machine elected as your simulation machine.
If a logon simulation fails, or is taking a long time, information is fed into the eG Manager dashboard so you can see the reason why.
In eG Enterprise v7, information is now also provided with screenshots.
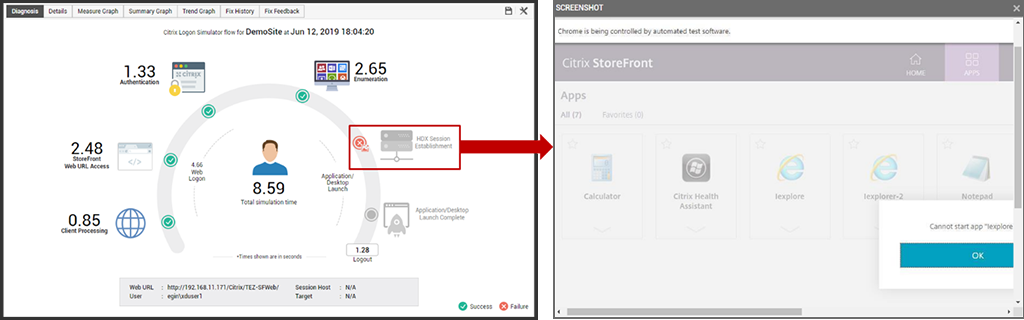
Having a screenshot provides the physical evidence that allows you to resolve issues faster. In the screenshot above, we know a simulation has failed with the message, "Cannot start app." At this stage I might to go looking at the VDAs hosting this application to make sure they are online and registered. The logs and text-based information are still there and available from the console should you need it.
Having screenshot evidence is something that I think will help eG Enterprise customers troubleshoot faster.
Full Session Simulation
Why settle for testing user logons when we can also test real user workflows! You see, in reality, user logons are just part of the overall experience. eG Innovations recognises that the user experience does not end there.
Users will open various applications and then perform multiple transactions with those applications. eG Enterprise is able to test these workflows by performing the same transactions, closing, and then logging out of the Citrix session.
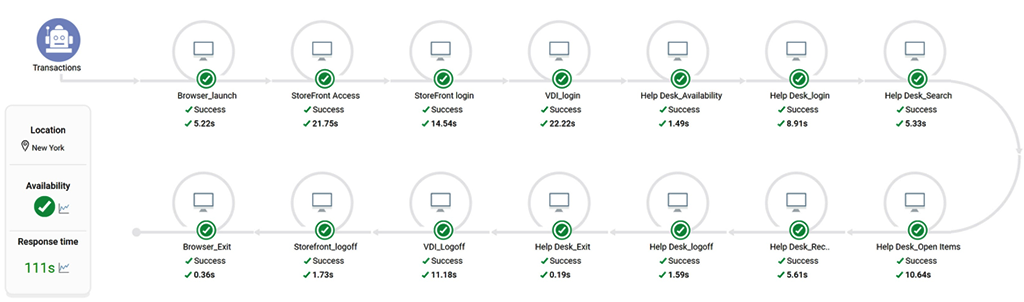
This is possible with the Full Session Simulator. With this feature, you can test the whole logon process as you did before, but go even further and test additional tasks, such as opening and authenticating to a SaaS application via your web browser before performing other tasks. The time it takes and the success of those workflow actions are also recorded and stored for reporting purposes or real-time viewing.
If you receive a failure, a screenshot is given as evidence to the IT administrator for easier and quicker troubleshooting of a problem.
In eG Enterprise v7, a new UI has been released for the Full Session Simulator, which shows each transaction that has been tested by the Full Simulator, including the success and time taken to complete the transaction.
This provides in-depth information in a super easy-to-read format, which gives IT administrators the power they need to troubleshoot a user experience that is not what a user expects and not one you aim to deliver.
New Interactive Session Logon Processing Times
In addition to synthetic monitoring capabilities, eG Enterprise also provides in-depth real user experience monitoring. By monitoring the session experience of every user connecting to the Citrix site in real time, Citrix admins can easily identify issues and troubleshoot them quickly. A combination of synthetic and real user monitoring is needed in a Citrix monitoring solution.
eG Enterprise already provided deep visibility of the Citrix logon process, covering visibility both from the Delivery Controller and the Virtual Apps Server / Virtual Desktops VM. To expand the visibility further, eG Enterprise v7 now reports on the Interactive Session phase of the logon process, which is made up of three sub-phases.
-
Pre-userinit - Overlaps with Group Policy Objects and logon scripts configured through Group Policy. If this portion of the logon process is high, consider investigating your Group Policy Objects and logon scripts that may be applying to the affected session(s).
-
Userinit - The time it takes userinit.exe to run logon scripts, establish network connections and start explorer.exe. This step can be high if there are network issues, connectivity issues to Domain Controllers, or corrupt logon scripts defined.
-
Shell - The time taken from userinit starting the Windows user interface and keyboard/mouse control being handed to the user. This can be high due to an overloaded VDA, an under provisioned desktop, or too many processes set to start at logon etc.
-
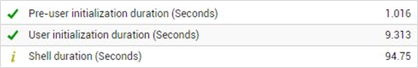
Being able to report on these phases of the logon process gives the Citrix Administrator more power and more ability to be able to effectively identity and troubleshoot slow logons for one to many users.
New Citrix Cloud Logon Processing Times
Many customers are opting to use Citrix Cloud and the Virtual Apps and Desktops Service. With this service, your control plane resides in Citrix Cloud and is managed by Citrix.
While eG Enterprise traditionally collected the logon duration metrics for on-premises Delivery Controllers, this new release sees the Citrix Cloud Delivery Controller metrics captured, now known as the Citrix Cloud Site component in eG Enterprise.
Local Host Cache (LHC) Activation Status
Local Host Cache offers continuity while your Delivery Controllers have lost access to the SQL database. Under such circumstances, users can still connect to their applications and desktops just as they normally would.
However, while Local Host Cache is there to protect against such failures, as an organisation you should monitor and be alerted on when Local Host Cache is used and understand the performance of Local Host Cache when it is used.
eG Enterprise helps with this by monitoring if Local Host Cache is active or not in your environment and how long it was active for. This can be important to identify if there are underlying connectivity issues between the SQL servers and Delivery Controllers.
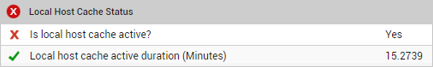
I think this capability will be gratefully received by Citrix administrators, as it allows the health of your database communication to be kept on top of.
User Input Delay
The user experience is greatly determined by the amount of delay between a mouse click or keystroke. That is why in this edition of eG Enterprise, a new User Input Delay metric is captured and reported on. eG Enterprise v7 reports user delay from three perspectives:
- Application/Process: How long it took the application/process to respond to a user's request/action during a session.
-
User Session: How much of a delay exists in the session to respond to a user's request/action.
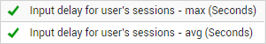
-
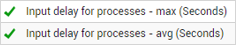
The Virtual Apps Server: Reports which user session had the maximum user input delay and the average delay across all user sessions on this server.
Essentially with User Input Delay, the time it takes for a user request to be picked up by a process or session is measured. For example, maybe a user is typing in Word or clicking to launch an application or file. When this happens, the request is queued before being picked up by the Kernel in the OS for processing.
Virtual machines that are constrained for resource are an obvious example of why the user input would be delayed.
User Input Delay is supported on Windows Server 2019 and above Operating Systems.
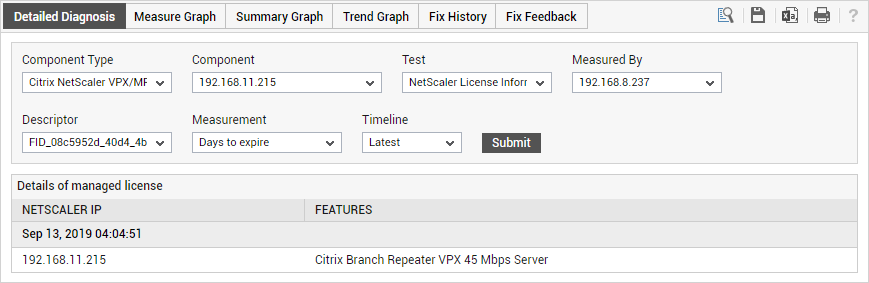
Citrix ADC License Monitoring
Licensing can be hard to keep track of and maintain. You have licenses for Microsoft products, your Citrix Virtual Apps and Desktops deployments, Citrix ADCs, and various other products. eG Enterprise v7 allows you to keep track of your Citrix ADC licenses, displaying the license expiry date and to which ADC the license is applied, all directly from the eG Manager console. With licensing information made easily available, you can manage renewals correctly in good time.
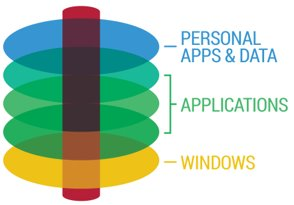
Support for Citrix App Layering
Citrix App Layering works by way of layering different parts of the virtual desktop. You have your base OS layer, and one to many App layers that sit on top, followed by the Platform layer. This layering aspect allows you to independently manage different parts of your desktop image and more easily tailor desktop deployments to your end users
For example, your OS layer contains just the Windows Operating System and patches. You can then have an App layer for Microsoft Office and a second App layer for Google Chrome. If one user only needs Chrome, you build a desktop from the Enterprise Layer Manager (ELM) containing just the OS layer and Google Chrome App layer. If a user needs both Google Chrome and Microsoft Office, you build a second desktop with those two App layers and the same OS layer. There is no need to build a new OS layer or "gold image."
In addition, a layer-on-demand feature called Elastic Layering allows an App layer to be delivered to a user as that user logs on. The layer, which is a virtual disk, mounts to the user's virtual desktop before or after logon.
With the benefits of App Layering and the increasing number of organizations deploying it, eG Innovations has released support for Citrix App Layering, allowing you to monitor the technology.
From the eG Enterprise dashboard, you can see how long it takes to mount Elastic Layers. Given that logon times are top of mind for Citrix Administrators and end users alike, an Elastic Layer does have the potential to impact logon times, so it is useful to get these statistics from a centralised dashboard.
From the eG Enterprise dashboard, you can also see which disks are mounted to the user's virtual desktop, including the disk filename and location.
Support for Citrix Workspace Environment Management
WEM (for short), to me, is another one of those technologies that was a welcomed addition to the Citrix family of products. This is Citrix's User Environment Management tool. With WEM, you can map printers, registry objects, network drives, applications, and so on to a user's desktop session after they have logged on, rather than during logon. This provides a faster user logon, which is satisfying to an end user and the business.
On top of logon optimisation and session customisation, WEM can also control the behaviour of application processes in respect to how much RAM and CPU they consume.
eG Enterprise v7 is now WEM-aware. The product is able to calculate how long it takes for the WEM Agent to process. A slow or stalled Agent will mean that an end user may not be receiving their entire configuration set. For example, they could be missing a network drive or printer completed that was due to be delivered by the WEM Agent, or there may be a delay. Ultimately, Citrix Administrators will want to know before a call is logged to the helpdesk.
Beyond Agent processing times, eG Enterprise also monitors WEM connectivity back to the database, license server connectivity, and more.
With a large number of customers deploying WEM into their environments, it becomes an important piece of infrastructure that needs to run optimally at all times. I like that eG Innovations has realised that and spent time developing monitoring capabilities for WEM.
Support for Citrix Federated Authentication Service
This is another Citrix product, and another one eG Innovations has released support for in eG Enterprise v7, which is fantastic.
Citrix FAS (for short) opens up your Citrix deployment to be used with many different authentication providers using SAML. With SAML, end users can authenticate to a third-party provider without having to supply a password.
The third-party authentication provider can be a trusted entity to Citrix Gateway or StoreFront, and this allows FAS to become involved and issue a user certificate to the user authenticating, which is presented to the virtual application or desktop to complete Active Directory authentication.
With support for FAS, you can now install an eG Enterprise agent on the FAS server to begin collecting information like the certificate that was issued to a user including certificate thumbprint and expiration date, or the error that prevented a certificate from being issued.
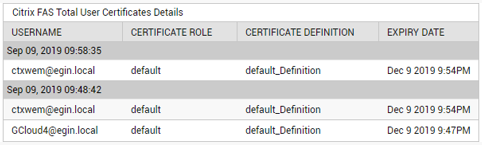
You can also see metrics for FAS like the total number of certificates requested, the load on the FAS server, how many seconds a certificate request took, and more. This information is important to maintain a healthy and optimal deployment of FAS.
Remote Control Actions
If your helpdesk staff can be fuelled with need-to-know information and a powerful toolset, they will be able to resolve tickets quicker and more effectively.
A monitoring solution like eG Enterprise already fuels the helpdesk with detailed information on the performance and health of your network, storage, hypervisors, and virtualised platforms. Going further than this, the Remote-Control Actions functionality within the product further powers helpdesk staff by offering many different actions that can be executed at the click of a button:
- Reboot the system
-
Last boot time
-
Execute command
-
Logoff a session
-
Shadow a user session
-
List printers in a user session
-
Get screenshot of a user session
-
Start & stop a service
-
Show IP configuration of the system
The above are just some of the actions available at the click of a button, all from within eG Manager. There is no need to jump between different management consoles just to get the information you need to resolve an end user reported issue. Having the ability to get what you want using the least amount of effort is at times invaluable.
New Dashboards
Dashboards provide text-based data visually so that we can more easily understand what is going on in our environment at a quick glance. eG Innovations has released three new dashboards in particular that will help you monitor effectively:
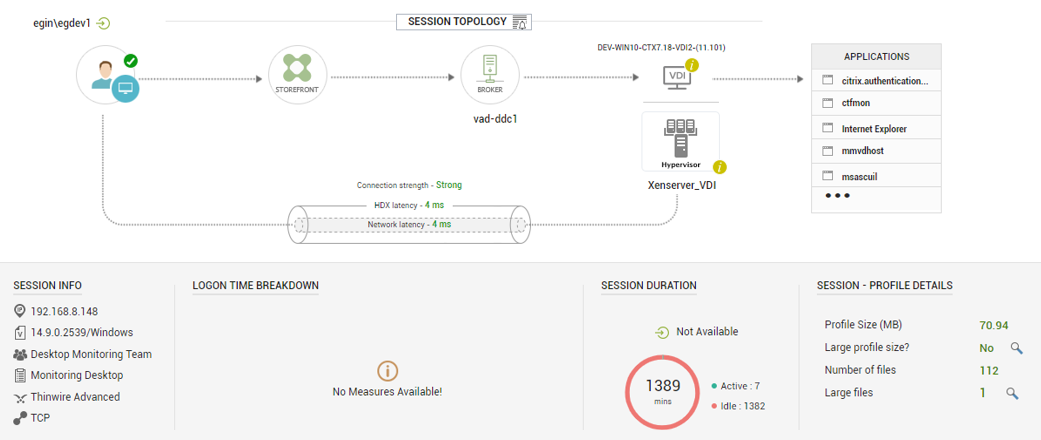
1. User Session Topology
The User Session Topology dashboard is made up of useful information about an active user session. If a user calls in to report a problem, you can easily search for their session and immediately see through a single page what their HDX/Network latency is, how long they have been actively using their session, their profile size, what VDA they are connected to, what Delivery Controller brokered their connection, logon duration information, session information, such as the end-device IP address, and more.
2. Geo Maps
I've spoke before about troubleshooting techniques and how going through process of elimination or identifying trends will allow you to troubleshoot issues faster. The Geo Maps dashboard is another tool that will help you do just that. With Geo Maps, you can get a high-level view of where the Citrix sessions are connecting from. If there is a problem in a specific region, for example slow sessions, you can identify it pretty quickly with less effort.
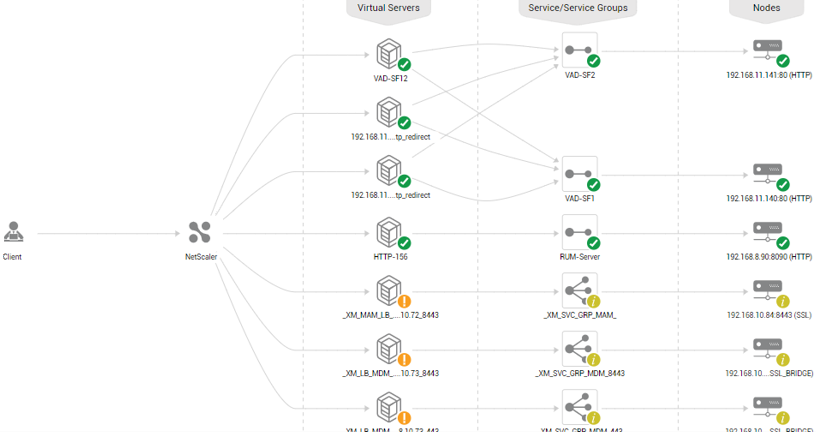
3. Citrix ADC Load Balancing Request Flow
Without having to log on to a Citrix ADC and spend time identifying the traffic flow, eG Enterprise displays that information for you so that you can trace the flow of traffic as a user connects through a load balancing virtual server hosted by ADC.
Not only that, you also get a view of the health status of the virtual servers, services, and ADC nodes, all from a single easy to view page. I think this is an excellent dashboard and a well-received addition to eG Enterprise.
New Report
With dashboard also comes new reports. eG Enterprise v7 ships with three new reports you can produce for your management team or for your own operational benefit.
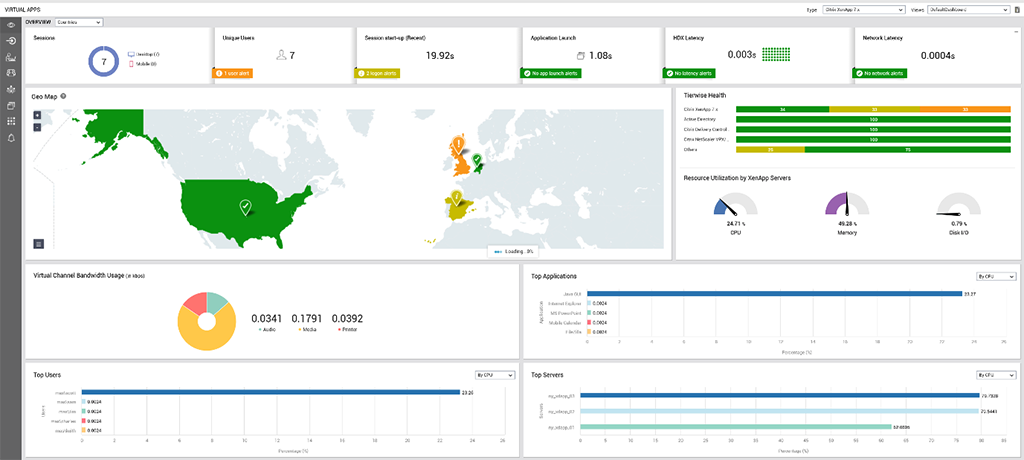
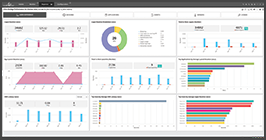
1. Citrix Virtual Apps Overview Report
This report has multiple tabs for specific information on user sessions, applications, events, servers, and licenses. However, there is a User Experience tab that gives a breakdown of the logon duration across a period of time, the application launch times, HDX latency minimum, maximum and average, and also the top users by logon duration and HDX latency etc. All the metrics are nicely laid out across pie and bar charts and can be clicked on for more granular analysis.
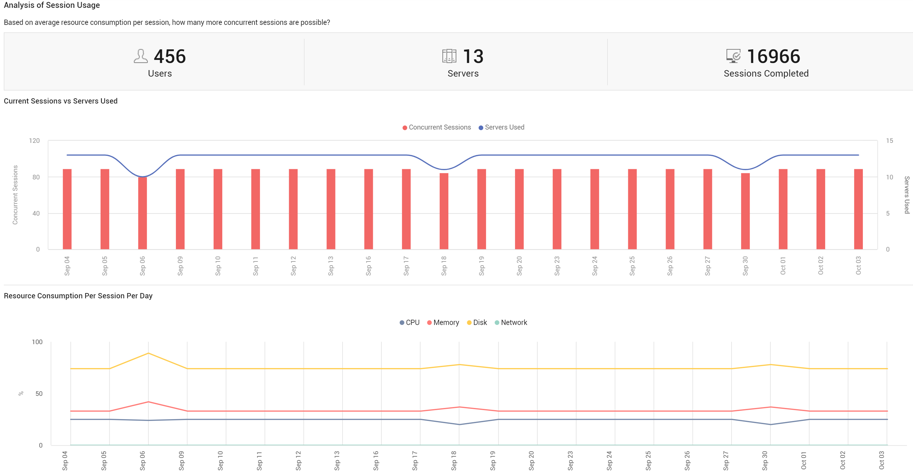
2. Capacity Planning Report
Noticing that more and more users are finding their way to your published desktops and applications? Sure, it is always good to see the adoption of the technologies you have in place, but if you don't keep track of usage patterns your end users could overload the hardware you have provisioned in the datacentre to run your virtual apps and desktops. Overloaded hardware in terms of the hypervisor, network, and storage will result in a negative user experience as user sessions contest for resources.
With the Capacity Planning Report, you can easily see trends over time in relation to how many user sessions you have active, the number of sessions completed, the CPU, memory, disk, and network consumption. These recorded metrics allow you to plan for the future and scale your hardware up (or maybe even down) according to usage, all before it is too late.
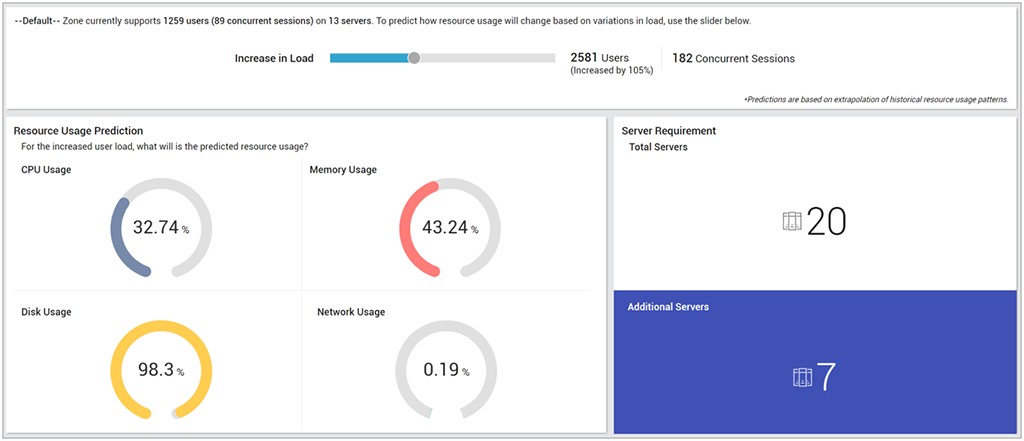
3. Capacity Prediction Report
Capacity prediction is often hard to gauge. How many servers will I need if 10% more users concurrently connect to my virtual apps and desktops over the next year, or year over year? If my organisation makes an acquisition, how do we capacity plan appropriately to make sure the new staff are given the same experience as the current staff?
eG Enterprise can help with the new Capacity Prediction Report, which based on a controlled slider, will tell you if your concurrent sessions did increase by 10%, for example, what extra CPU, disk, network, and memory would be consumed. The report also gives you the number of additional servers you would likely need to support that extra load. The predictions are calculated based on the historical resource usage collected within your environment over time, so the product certainly holds a good amount of valuable information it needs to make capacity predictions.

Summary
eG Innovations has invested heavily in the Citrix monitoring space so that you can deliver the best experience possible to your end users wherever they are and from whatever device they use. With a host of support for new features and products, user experience focused metrics, dashboard enhancements, new reports, and more, eG Enterprise v7 is now uniquely positioned to address digital workspace user experience challenges and performance problems.
This review has only been done from a Citrix standpoint. eG Enterprise provides the same depth and breadth of performance visibility for VMware Horizon, too. Additionally, eG Enterprise can be used to monitor enterprise applications, web applications, and SaaS applications delivered via Citrix/VMware Horizon. Some new monitoring inclusions in eG Enterprise v7: Docker, Kubernetes, PHP and web apps, Redis, Hadoop, Office 365, and more. For the full list of new enhancements, you can visit:
https://www.eginnovations.com/product/whats-new
You can start a free trial of eG Enterprise v7 and evaluate in your Citrix environment based on your Citrix performance monitoring needs.