Synthetic monitoring techniques are quite useful for proactively monitoring and testing availability and performance of Citrix virtual applications and desktops. Especially when it comes to measuring logon performance, simulation is a must-have utility for Citrix admins. In the below review, George Spiers evaluates the pros and cons of Citrix Director's App Probing functionality as well as eG Enterprise Logon Simulator.
The original review was published on George's site https://www.jgspiers.com/app-probing-vs-logon-simulation/.
Read on to see why George thinks:
In this article, we discuss the need for simulated logon monitoring in a Citrix environment, for what reasons do we need to have such monitoring in place, and what products are available out there, to achieve synthetic monitoring of our applications and desktops.
The Need for Synthetic Monitoring
Getting down to the fact first: Synthetic monitoring is the process of emulating actions that would otherwise be performed in the real world, by real people.
Maybe you have a customer-facing website, a database that serves a website or system, an internally hosted application or service, or in our case a bunch of applications and desktops deployed via Citrix Virtual Apps and Desktops. Whatever you have running that serves other people, it is in your interest to make sure the service you provide is performing optimally. If you don't, customers lose trust in your ability to provide a service or lose trust in the service they have been provided with.
In a Citrix EUC scenario, we have a bunch of applications and desktops deployed via Citrix Virtual Apps and Desktops 7. As we scale the environment to multiple applications and hundreds of desktops, it makes sense for us to employ on monitoring tools to actively monitor our environment. By using such monitoring tools, the ICT department can be alerted whenever a component in the infrastructure is in a failed state, or under some form of stress. Alerts allow ICT to act before there is any further impact, impact to our user base and to their productivity.
When deploying Virtual Apps and Desktops in your organization, the service must be reliable at all times and optimally performing. Any slight degradation in the environment will likely be picked up by end-users, and tickets will start to be logged against the helpdesk.
When monitoring systems report that your environment is healthy, it may not always guarantee that the end-users accessing their applications and desktops are receiving an experience that they come to expect. As with any end-user computing environment, there are a lot of components in play. Active Directory, file servers, hypervisors, networking switches, and storage systems are just some of the main pieces of the jigsaw. That means you have a lot to monitor, and in fact not every monitoring system can cover everything in your environment from a monitoring perspective. To put it into context: it is hard for any monitoring system to make judgement on the experience a user is receiving.
The other struggle within the enterprise given the fact above is the amount of monitoring systems you may have deploying in your environment. With multiple monitoring systems and dashboards in play, it can be hard to catch everything that goes on whilst ICT staff deal with their own business as usual duties and different projects.
So, as you can imagine, it would be nice if we could have a dedicated person launching applications and desktops all day and reporting back to IT as to how the performance is. That will likely never happen unless it is an ICT member of staff who will without doubt quickly get bored of that job.
Luckily, we have some synthetic monitoring solutions in the market to do what we need to do, in an automated fashion. Synthetic monitoring is the process of automating the actions of our real user-base. In simple terms, we can use logon simulators to simulate logging into the Citrix environment and then launching applications and desktops. Not only that, but the ICT team can be alerted whenever the launch of a resource fails or potentially more granularly; such as a certain part in the process fails or was slow.
What you have is a monitoring simulation system acting like a real user, and in fact testing multiple components in your environment. During the launching of an application or desktop, many different components from storage, networks and infrastructure come into play and must work together to achieve the end, desirable result. By using logon simulation to simulate a real user's actions, you are running tests against Citrix Gateway, StoreFront, application enumeration, brokering, profile loading, desktop load and so on.
What Tools Provide Synthetic Monitoring?
Two products that we will concentrate on today offer logon simulation:
- Citrix Director with their Application probing feature. The Application probing feature, which is built in to Citrix Director, was initially released in Citrix Director 7.18.
- eG Innovations with their eG Enterprise Logon Simulator product. This product is part of the eG Enterprise suite.
An Overview of Application Probing using Citrix Director
Application probing is a new component that Citrix released with Citrix XenApp & XenDesktop 7.18. The solution consists of an agent (also referred to as a probe agent) that automates the launch of published applications and feeds the results to Director.
The agent is installed on a Windows machine that must have Receiver for Windows 4.8 or newer, or Workspace app 1808 for Windows or newer installed. You then configure the agent to connect to Director and configure probes directly from the Director console.
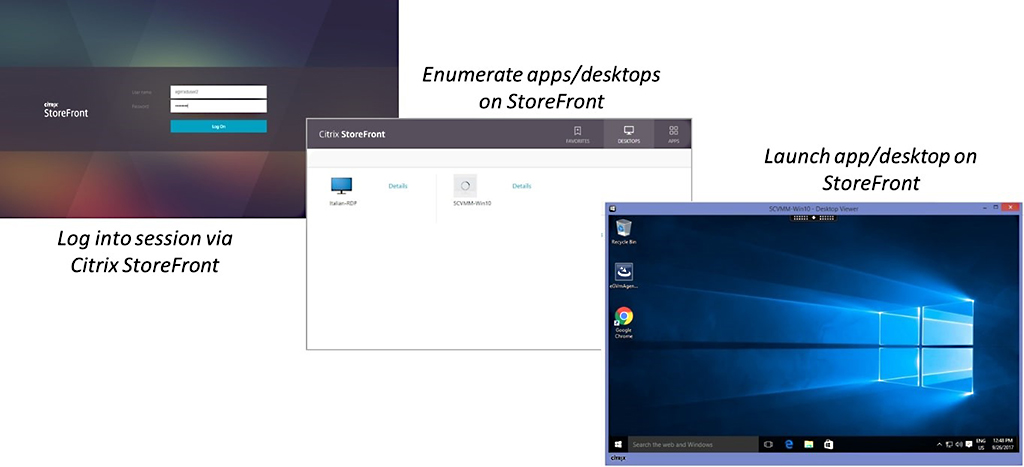
Given that there are many steps involves with launching an application, application probing analyses the below steps and reports on their failure or success:
- StoreFront reachability
- StoreFront authentication
- Application enumeration
- ICA file download
- Application launch
The benefits of this type of proactive monitoring by application probing is that you are effectively testing the majority of the Citrix infrastructure such as the StoreFront servers, Delivery Controllers, VDAs, and so on, and getting failure or success results for each component whenever it comes to launching resources.
An Overview of eG Enterprise Logon Simulator
Logon Simulator is a synthetic monitoring tool provided by eG Innovations, that launches connections to applications and desktops during defined times of the day. As known, many steps in the exist when connecting to a published application or desktop provided by Citrix Virtual Apps and Desktops, and Logon Simulator analyses many of these steps and captures the time it takes to complete them.
The Logon Simulator simulates a user logging on to either StoreFront, or Citrix Gateway through a Google Chrome browser. A specific application or desktop is launched via Workspace app for Windows, and then eventually logged off. The Logon Simulator itself will typically be a virtual Windows PC or Server, with the lightweight eG Agent installed.
The benefits of Logon Simulator are that it is effectively testing the majority of the Citrix infrastructure such as the StoreFront servers, Delivery Controllers, VDAs, profile servers and so on, and reporting back on how effective these components have or have not been in the launch process.
The Logon Simulator component comes packaged as part of the eG Enterprise monitoring solution, or available as a standalone product. Both on-premises and SaaS (Software as a Service) offerings are available.
The main steps in the session launch process that Logon Simulator captures are:
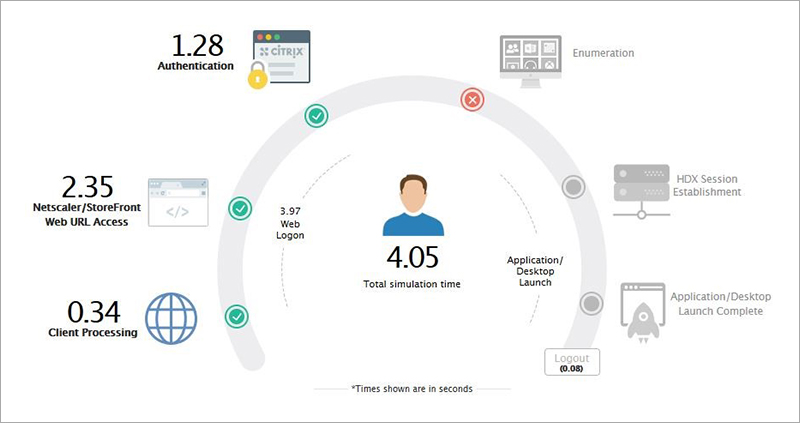
- Client Processing
- NetScaler/StoreFront Web URL Access: The time it takes to access the Citrix Gateway URL, or the StoreFront URL.
- Authentication: The time it takes to authenticate to Citrix Gateway and/or StoreFront.
- Enumeration: The time it takes StoreFront to enumerate the applications and/or desktops provisioned to the Logon Simulator user.
- HDX Session Establishment: The time it takes the Logon Simulator machine and a VDA to establish an HDX session.
- Application/Desktop Launch Complete: The time it takes for the application or desktop to complete its launch.
The main steps in the session launch process that Logon Simulator performs are:
- The simulation tests begin with the simulator opening Google Chrome and connecting either to Citrix Gateway, or StoreFront. The time is captured.
- Authentication to Citrix Gateway or StoreFront using predefined credentials takes place, and the authentication time is captured.
- The simulator then captures the time it takes for enumeration to complete.
- The simulator launches the application or desktop that it has been instructed to launch, and the duration of the launch is recorded.
- Once the launch is complete, the simulator performs a log off. This information is also captured.
- This process repeats for each application and/or desktop that has been configured for testing.
- Captured metrics are passed to the eG Manager, which may be hosted on-premises or in the cloud. The metrics are processed, and various graphs are formed for the administrator.
Application Probing at a Glance
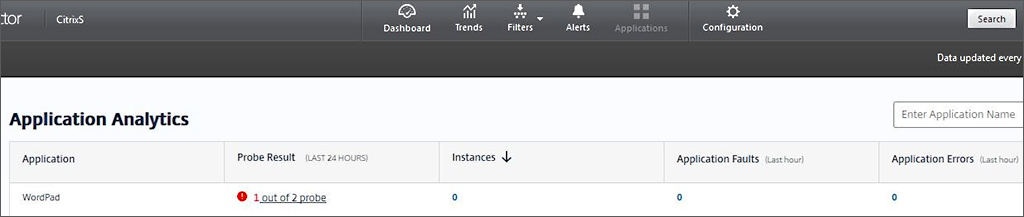
When you deploy a probe agent, and after configuring it to probe an application, the Director dashboard will display Application Analytics results over the period of 24 hours. This page is basically a quick summary that you can check on to review probe results. It shows the number of probes that are configured within your Site, the application that is being probed, probe results from the last 24 hours, and the number of application faults etc. as a result of failed probes.
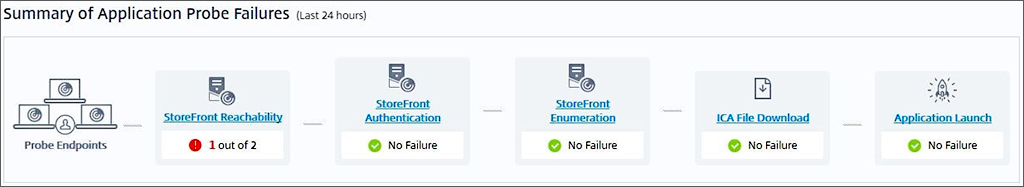
Towards the bottom of the Application Analytics page appears the Summary of Application Probe Failures panel that lists out each component that application probing tests, and if there have been any failures with any of the components over the past 24 hours. As you can see from the below screenshot, 1 probe out of 2 failed at the StoreFront Reachability stage.
If you click on the StoreFront Reachability hyperlink, you can see a filtered results view, which in this case is showing the probe results that have failed at the StoreFront Reachability stage, over the last 24 hours. This is simply a filtered view under Trends -> Application Probe Results.
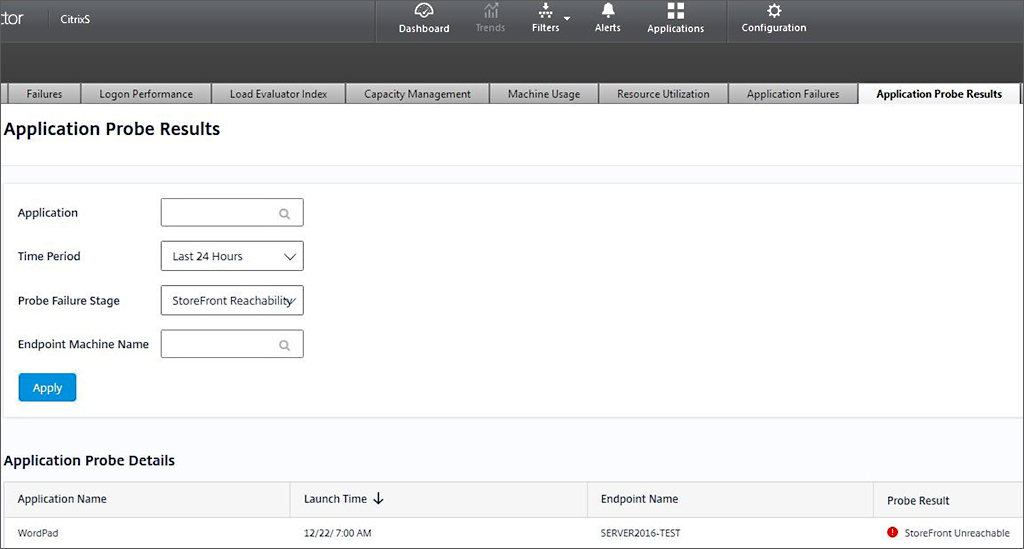
You can change the filter conditions to show all probe results over the past 7 days for example. Some probes here failed at the StoreFront Reachability and Application Launch stages.
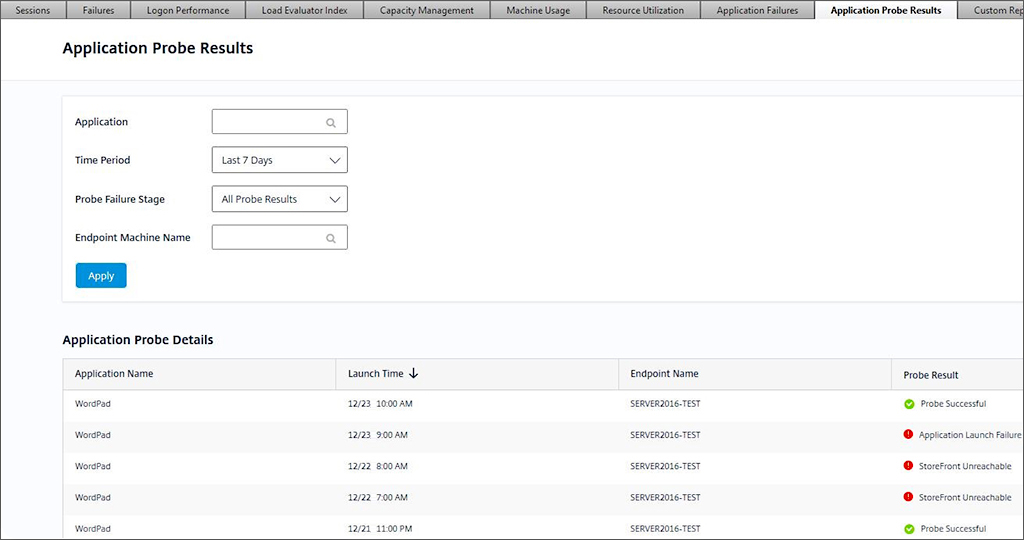
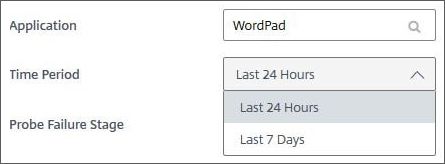
You also have the option of viewing results over 24 hours. If you want to view results for a specific application, simply type the application name in the Application field.
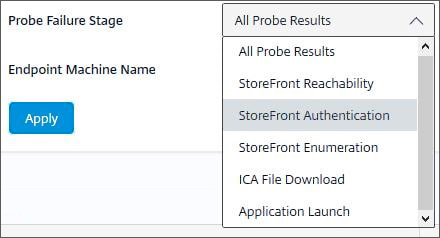
The different stages can also be filtered on.
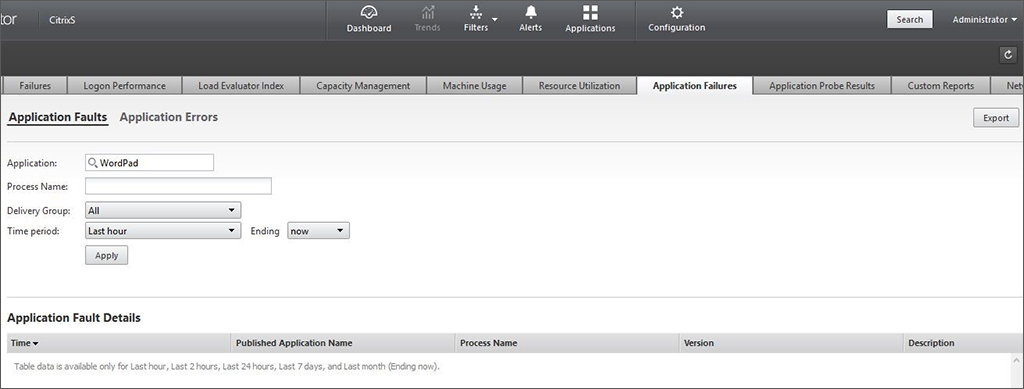
If any probe fails at the Application Launch stage, failures are also recorded under Trends -> Application Failures. You can export this data to PDF, CSV or Excel format.
eG Enterprise Logon Simulator at a Glance (SaaS Edition)
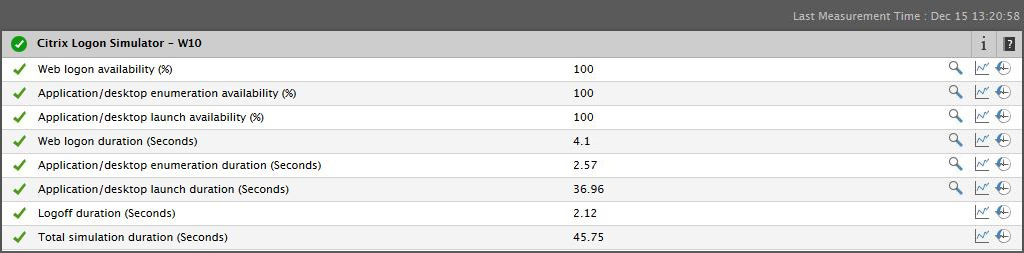
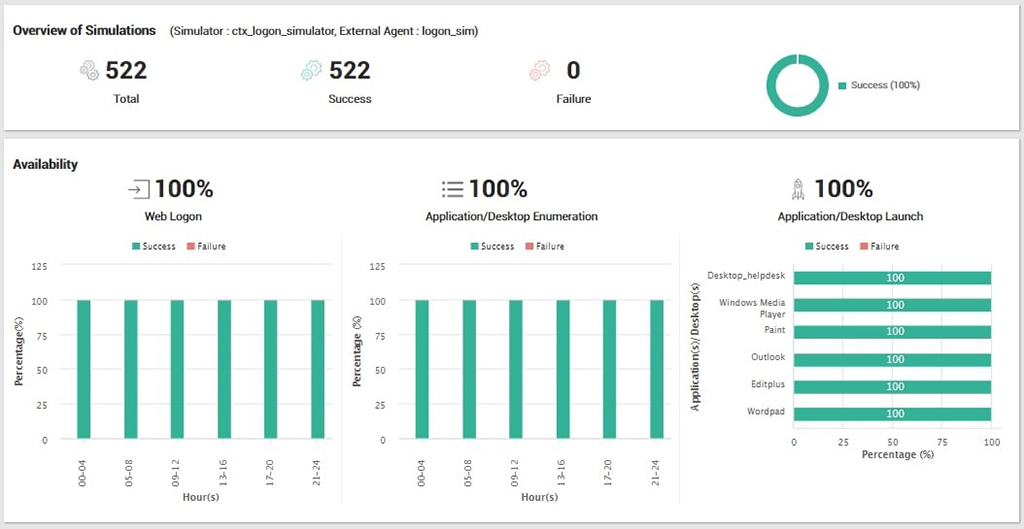
When you deploy a Logon Simulator agent, and after configuring it to run simulations, the eG Manager dashboard will be populated with various statistics captured from the last measurement/simulation that ran. For example:
- Web logon availability (%)
- Application/desktop enumeration availability (%)
- Web logon duration (Seconds)
- Application/desktop launch duration (Seconds)
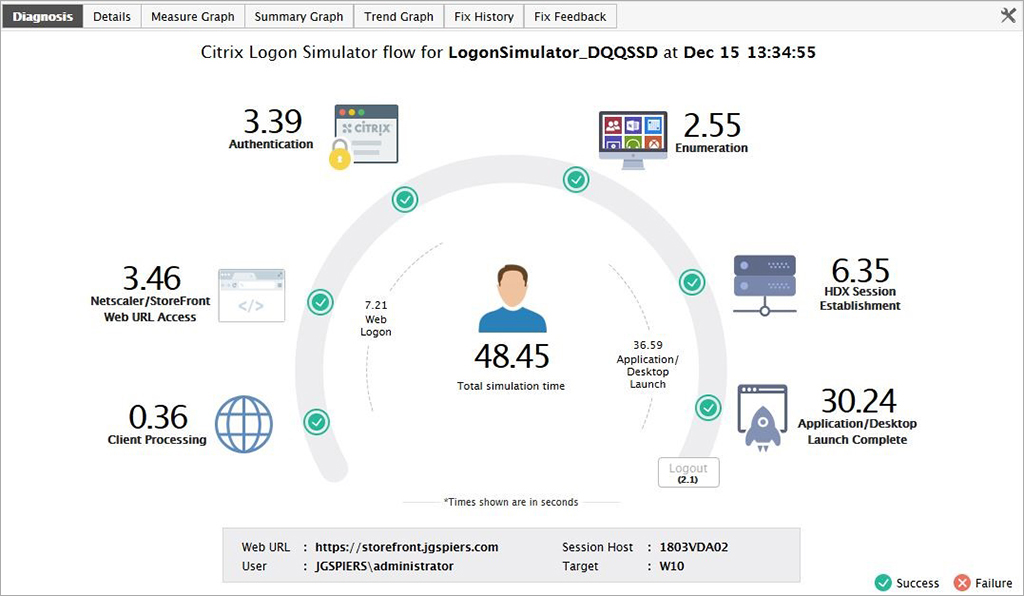
Clicking on the magnifying glass to the right of any of the metrics will display a nicely generated graphic to show how long each step in the logon process took. In this example, the total simulation time was 48.45 seconds, made up of authentication, enumeration, desktop launch and so on. Each step also has a green success tick. If a step was to fail, a red failure mark would show against the step.
Several different tabs are available for review.
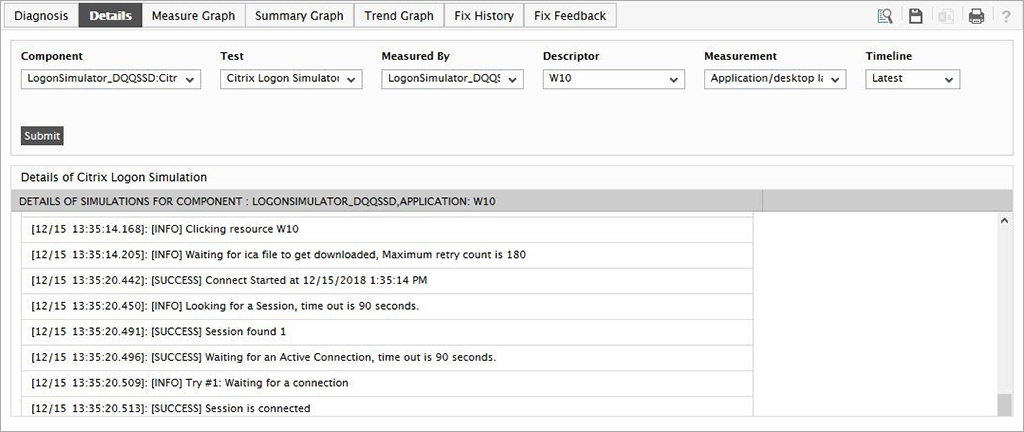
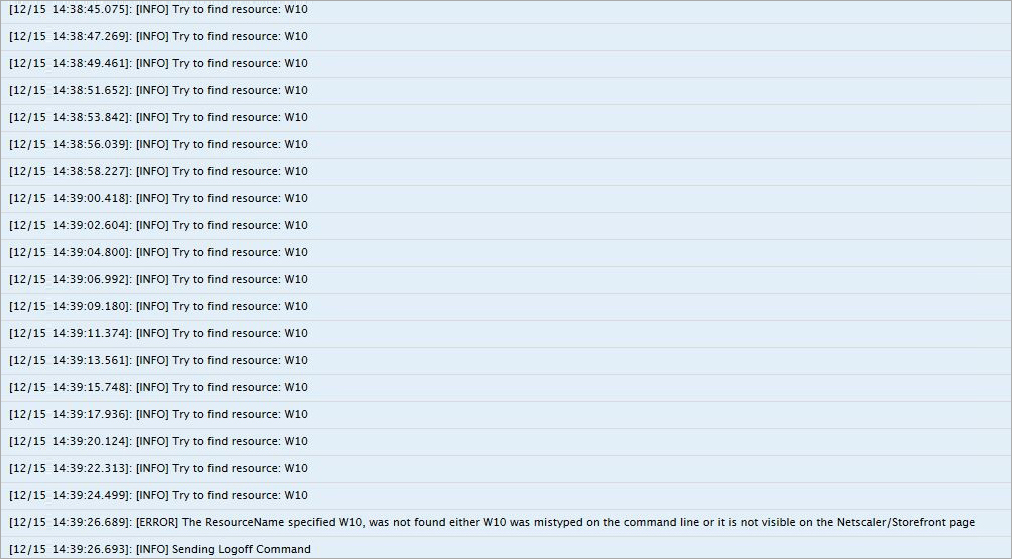
The Details tab shows an in-depth log of all the steps the simulator has taken during the most recent simulation. This is useful if you want to further break down the steps the simulator has gone through. In this example, you can see that the simulator recorded the time when it clicked on a published desktop resource called W10, and then when the session connection, a short 6ms later.
If you want to view detailed logs from historic simulation runs, you can simply adjust the timeline to show logs over a longer period of time, or from a certain point in time.

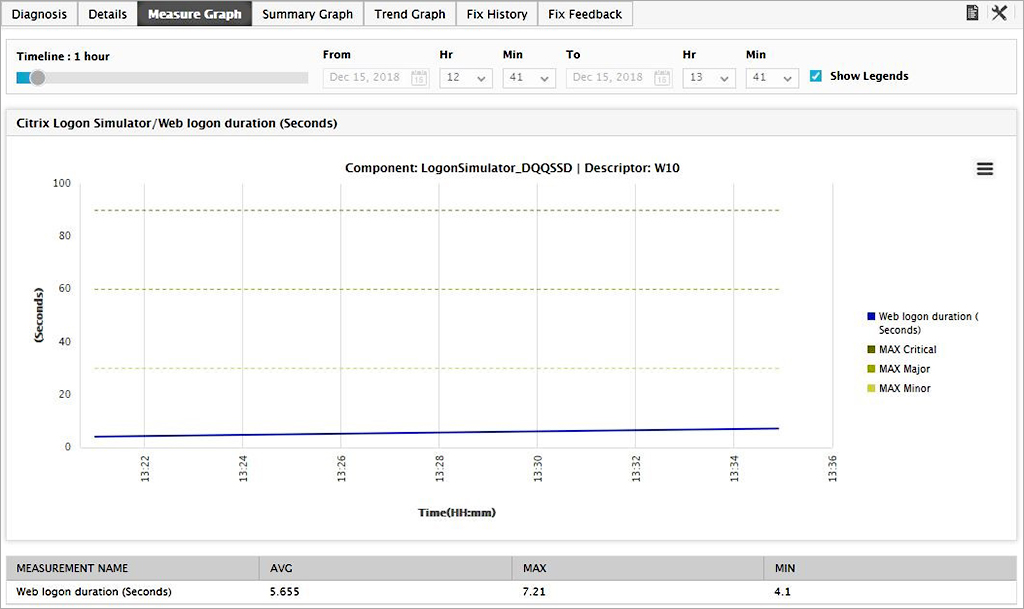
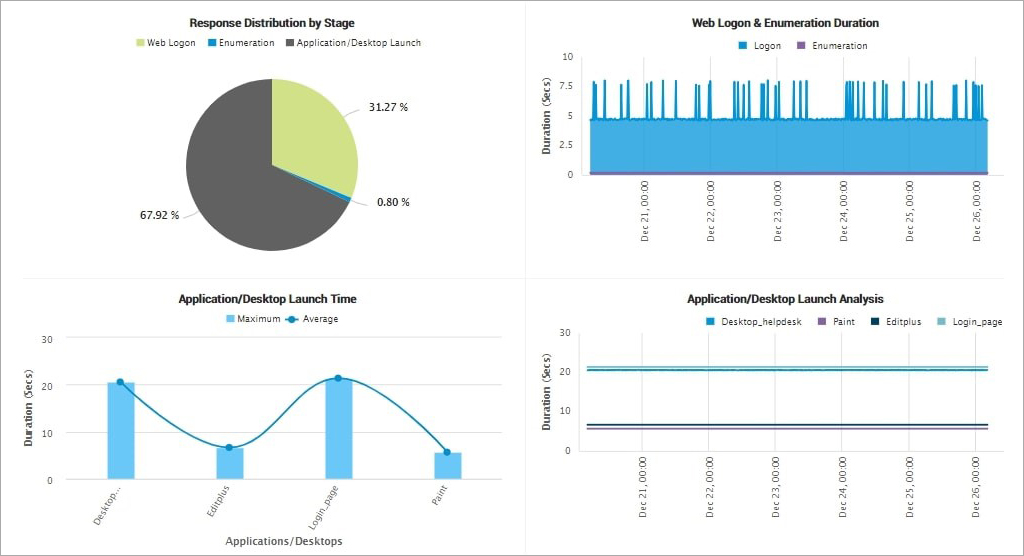
Back on the main dashboard, as previously explained, metrics from various measurements are captured and displayed from the last simulation that ran. For example, Web logon duration (Seconds). In this example, we can see that the least simulation recorded a 7.21 second web logon duration to StoreFront. If you want to quickly view measurements of this metrics from historical simulations, click on the measurement time.
With the timeline set to 1 hour, you can see the average, maximum and minimum time this step took in the logon process, including a graph. You can adjust the timeline using the slider to get a wider look at this step. These graphs and reports can be downloaded as PDF, JPEG, PNG or printed.
If you click on the document icon to the top right, beside the tools icon, an easy to read table is produced for the Web logon duration measurement showing each result. This table can be exported to CSV.
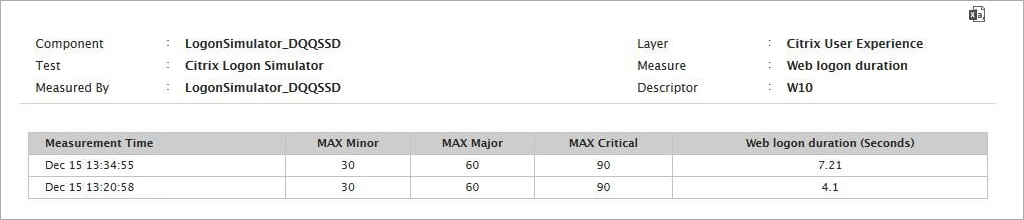
Note that the tools icon on the previous screen can be used to change the measurement you want to view or add more to the graph.
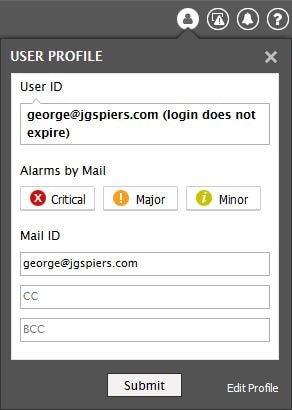
On the main dashboard screen, you can configure email alerts by clicking on the person icon to the top-right of the page. Emails can be sent upon the generation of a Critical, Major or Minor alert. You can choose one or more of these categories.
In this example, the main dashboard is displaying that an issue has occurred with the latest simulation. We can click on the magnifying glass again to see what has gone wrong. The magnifying glass stands for DIAGNOSIS.
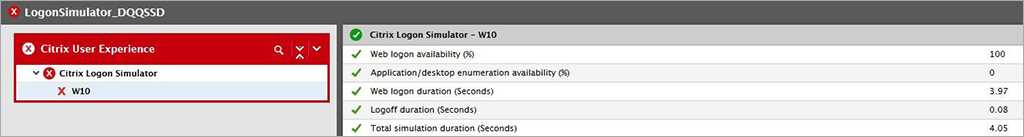
Here, the diagnosis shows that the enumeration step failed. This makes it much easier for a Citrix administrator to stop guessing and achieve faster resolution times by understanding that there must be an issue with the StoreFront server(s) or Delivery Controller(s).
The log from the Details tab shows more information and informs that the published desktop resource named W10 could not be found. In this example, it turned out that the Delivery Controller was not responding.
Historical reports can be generated from the eG Enterprise Logon Simulator web console. Reports can be scheduled for email delivery or generated and exported as PDF on demand. The below image shows a report with the history of successful/failed logons over a specific period of time and the historical trend of various steps of the Citrix logon process.
Comparing the Simulation Steps
The below table lists the simulations that each product performs.
|
Director Application Probing |
eG Enterprise Logon Simulator |
| StoreFront/Gateway access |
 |
|
| Authentication |
|
|
| Resource enumeration |
|
|
| ICA file download |
|
|
| Session establishment |
|
|
| App/desktop launch |
|
|
| App access |
|
Not in Logon Simulator, but available using Full Session Simulation. |
| App/desktop log off |
|
|
Pros, Cons, Gaps of Each Product
Citrix Director – Application Probing
Pros:
- Probing results are shown in the Director console, reducing the need for a separate console.
- The Agent works behind NAT, so can reside in the internal network.
- Citrix Gateway is supported with the 7 1811 release of Director.
- Citrix Cloud/Workspace is supported.
Cons:
- A small, lightweight agent needs to be placed on a dedicated machine.
- Not all stages are captured in regard to time to complete. For example, application enumeration time is not captured.
- Requires a Premium (formerly Platinum) Virtual Apps or Virtual Apps & Desktops license.
- Reporting capabilities are scarce.
- Cannot probe published desktops.
- There is no ability to schedule probe repeats. You need to create a new probe to select different probe execution times. For example, if you want to set up a simulation to test every one hour through the day, you have to configure 24 probes.
eG Enterprise Logon Simulator
Pros:
- Can be deployed both on-premises or as a SaaS offering.
- Agents communicate outbound only via HTTPS, to the eG Manager server. This reduces firewall and routing administration.
- The Agent works behind NAT, so can reside in the internal network.
- If you have a disclaimer set on your VDAs, the simulator can accept it and proceed with the simulation.
- StoreFront 2.0+ and Gateway 9.3+ is supported.
- Citrix Cloud/Workspace is supported.
- Advanced reporting capabilities and deep insight into the logon process is offered.
- The full logon process is captured.
Cons:
- A small, lightweight agent needs to be placed on a dedicated machine.
- Only Google Chrome is supported as a browser, and therefore must be installed on the Logon Simulator machine.
- The machine that runs simulations must always be logged on as a local administrator account.
Licensing
Application probing by Citrix is available under the Premium (formerly Platinum) editions of Virtual Apps or Virtual Apps & Desktops.
eG Enterprise Logon Simulator is available as a SaaS application or on-premises software. It's licensed by the number of endpoints (one agent per endpoint) from where simulations are run.

Conclusion
Both products are very easy to deploy and configure and will have you proactively monitoring your resources in no time. There may be cases when you would choose one product over the other, so I thought I'd list some examples below:
- If you already have Platinum licensing and just want a brief proactive check of your applications, it makes sense to use application probing in your environment. The solution easily integrates into your existing Director dashboard and provides easy to read success and failure information with each probe that is ran.
- If you are looking for a product that gives more in-depth information, eG Enterprise Logon Simulator does just that. Not only are success and failures of each logon step recorded, but also the time it takes to complete each step. This is very important, as whilst components in your environment appear to be healthy, they may be performing slowly and impacting the user experience, and user productivity. Advanced reporting is also available, which ultimately aids you with more information that you can use to identify problems faster, offering quicker resolution times.
There's also a free version of the eG Enterprise Logon Simulator available. It has restricted access for the number of simulated apps and desktops, but it's a great tool to explore the logon simulation capability before obtaining the paid version.