The original product review was published on Rajesh's site: http://vmarena.com/eg-enterprise-for-virtualization-monitoring. Read on to find out why Rajesh feels:
In today's post, I will be sharing my feedback on my recent review and product evaluation of eG Enterprise version 6.3. eG Enterprise is an end-to-end IT performance monitoring solution that supports many applications, databases, storage arrays, network devices, virtualization and cloud platforms out of the box. This blog is my review on how eG Enterprise stacks up for virtualization monitoring. eG Enterprise is available in both on-premises and SaaS deployment models. I tested the on-premises variant on my VMware infrastructure in my lab. Here is what I think.
eG Enterprise is a powerful monitoring solution that analyzes and monitors your entire VMware infrastructure. From a single pane of glass, this solution gives complete visibility and end-to-end monitoring of all aspects of VMware virtual Infrastructure, including the vCenter, ESXi servers and guest operating systems. eG Enterprise has its own patented automatic root-cause diagnosis technology which will help pinpoint performance issues quickly.
eG Enterprise monitors vSphere hypervisors in an agentless manner. You need to provide details of your vCenter or it can directly connect to the hypervisor. In either case, you must provide credentials that the tool uses to connect to and extract metrics from the VMware infrastructure. Within minutes, eG Enterprise auto-discovers the virtual machines on each hypervisor and tracks their status and resource usage. By choosing to install a lightweight VM Agent on the virtual machines, you can augment the monitoring visibility inside the virtual machine.
Monitoring Capabilities
There are many virtualization monitoring solutions available in the market, but most of the tools are having challenges with monitoring the guest operating systems. What I found interesting was that with the same model and using the same license, eG Enterprise gave me insights into the guest operating system and told me what application(s) are taking up CPU, memory, handles, disk and other resources inside the VMs.
A unique aspect of eG Enterprise is that it presents virtual machine monitoring data from two perspectives:
#1 Outside view of a VM: This tells us how the resource utilization of the VM is. How much of the allocated CPU, memory, disk, network and GPU is consumed by the VM. This helps identify under-utilized and over-utilized VMs.
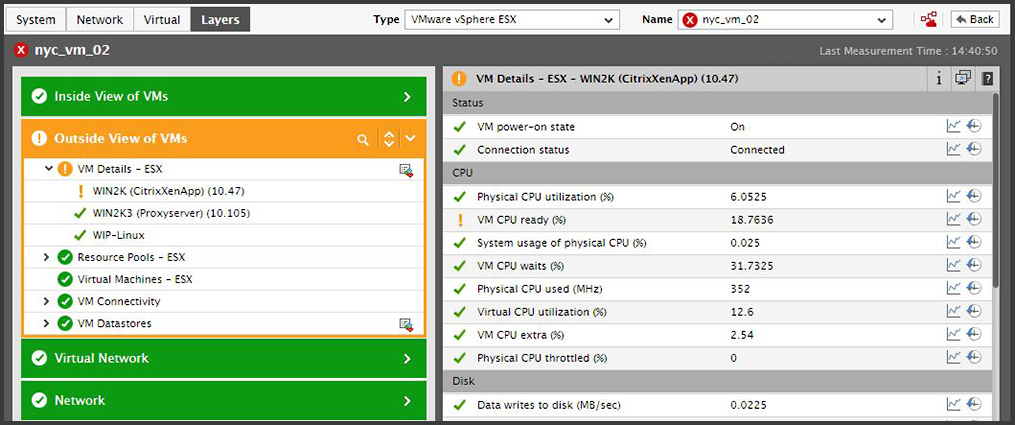
Outside view of a Virtual Machine
#2 Inside view of a VM: This tells us what applications and processes inside the VM is responsible for consuming the VM resources. This helps identify resource-intensive applications running inside a VM.
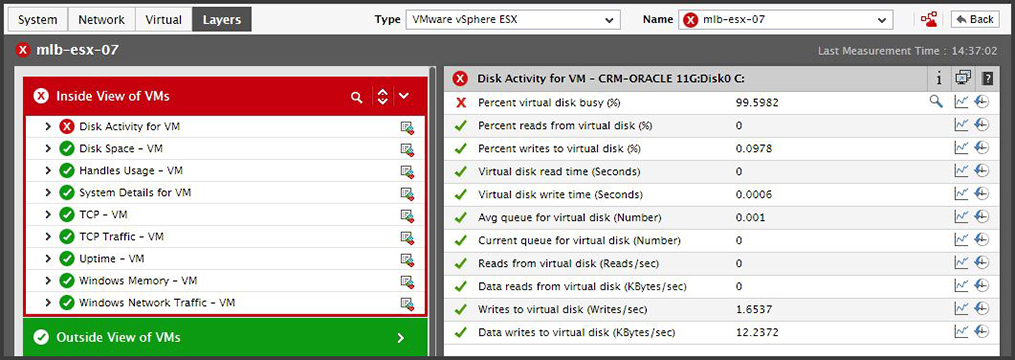
Inside view of a Virtual Machine
I have been working with many monitoring tools to identify root cause of the issues with my applications slowness. I have spent of lot of time to check all the event logs and interacting with application vendor to check the logs, scanning hypervisor-level metrics. Most of the time everyone seems to be throwing the issue to other causing finger pointing between teams. In such cases, eG Enterprise will come in handy because it has the ability monitor your infrastructure from top to bottom and present the metrics categorized into layers. Without having to sift through a ton of metrics and log data, this helps the virtual administrators to easily identify where the problem area is: Is it an issue inside the VM, or a resource contention at host, issue with VM process, virtual network, network, operating system and hardware?
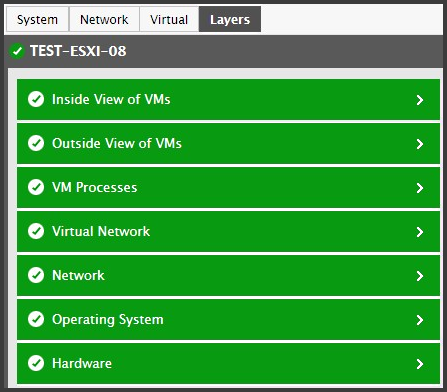
Layer model approach for problem diagnosis: ESXi Server
Let's understand what the other layers from the ESXi layer model dashboard provides:
- VM Processes – In this layer, the processes inside the hypervisor are monitored, and all errors are captured
- Virtual Network – In this layer, hypervisor virtual network, port group, and virtual switches are monitored
- Network – In this layer, hypervisor, physical network connections (vmnic0, vmnic1) are monitored
- Operating System – In this layer, hypervisor operating system is monitored such as, CPU, RAM, DISK utilization and every component's process consumption.
- Hardware – In this layer, all the all the hardware components of the bare-metal hypervisor are monitored
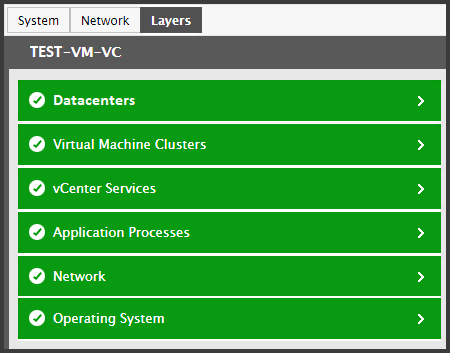
eG Enterprise also has a purpose-built monitoring dashboard for vCenter Server in a similar layer model approach. Each layer monitors the overall health a specific component and provides information on errors, events, network status, process status, services, and any issue related to the vCenter Server.
Layer model approach for problem diagnosis: vCenter Server
In addition, you can monitor System, Network and Virtual level metrics from a nice graphical view that provides detailed information for resource usage analysis.
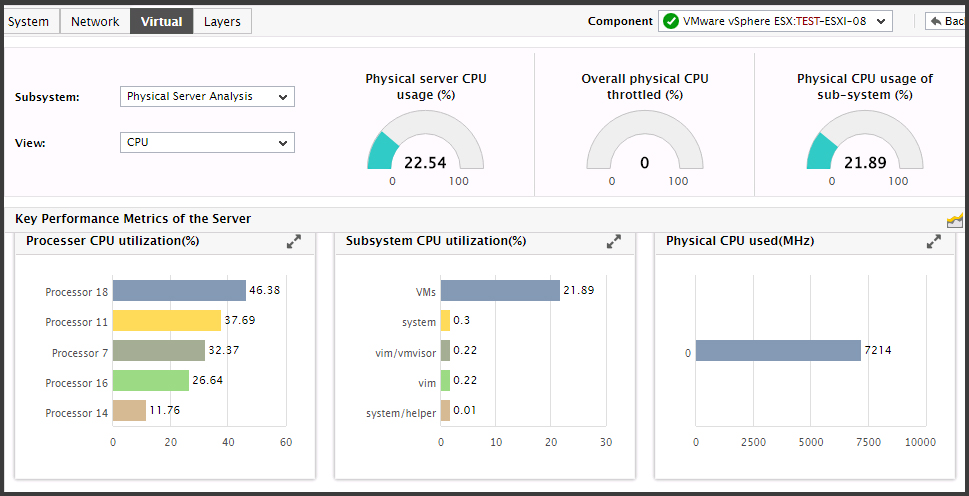
Built-in dashboard for performance analysis
Using a patented performance correlation technology, eG Enterprise automatically isolates the cause of a performance problem from its effects and allows the virtualization admin to find the underlying cause of the problem in no time.
In terms of depth of visibility, eG Enterprise provides many metrics including balloon memory, swap memory, vCPU, pCPU, CPU wait, disk usage, vSwitches, VM migration clusters, vSANs, and more. This datasheet will give more details on the metrics collected by eG Enterprise.
Custom Dashboards and Alerting
In addition to pre-built dashboards, eG Enterprise also allows the creation of custom dashboards. These dashboards can be accessible through published URLs from any web browser, this will work with all monitors which you have access to network and web browsing facility.
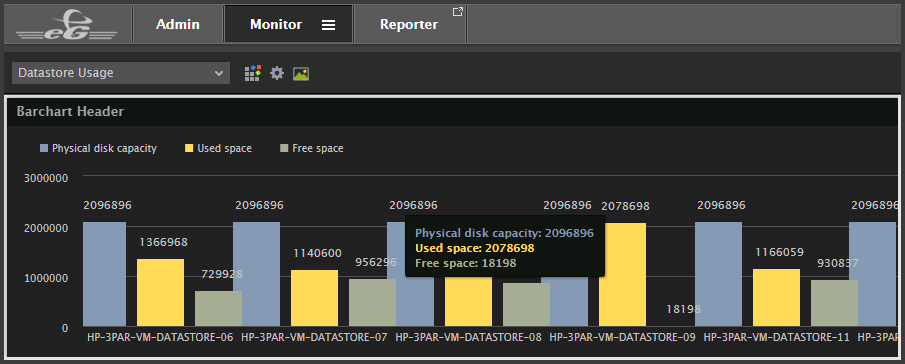
Custom dashboard created to monitor datastore usage
Alert configuration is another cool feature with eG Enterprise, I got notified of errors, warnings and problem alerts in a timely manner through email or push notifications on the eG Mobile App. Alert notifications will be showing on monitoring console too.
Topology Map and Dependency Analysis
Another interesting aspect of monitoring with eG Enterprise is the topology map. eG Enterprise auto-discovers the entire IT infrastructure and automatically maps interdependencies between components: application-to-application, application-to-VM, VM-to-host, and host-to-datastore/SAN. On intuitive topology map, the IT administrator can view the entire service topology spanning all applications, physical/virtual server, network devices, storage, etc. Using its patented auto-diagnosis, eG Enterprise isolates the root cause of performance problems. For example, administrators will be able to know how a virtualization issue affects the application, or how a storage issue affects VM performance.
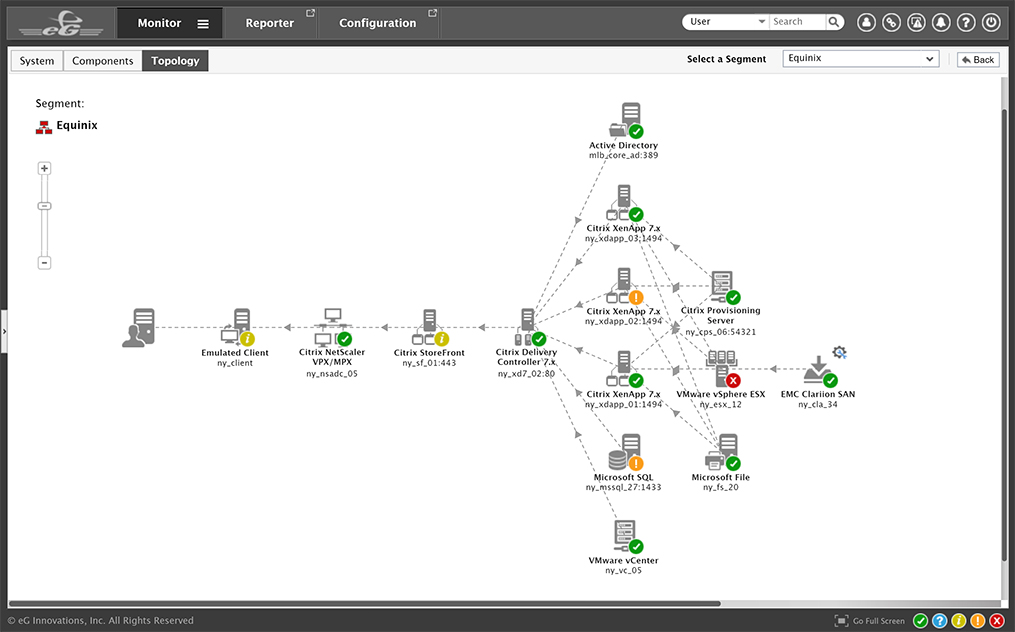
End-to-end IT infrastructure topology and dependency mapping
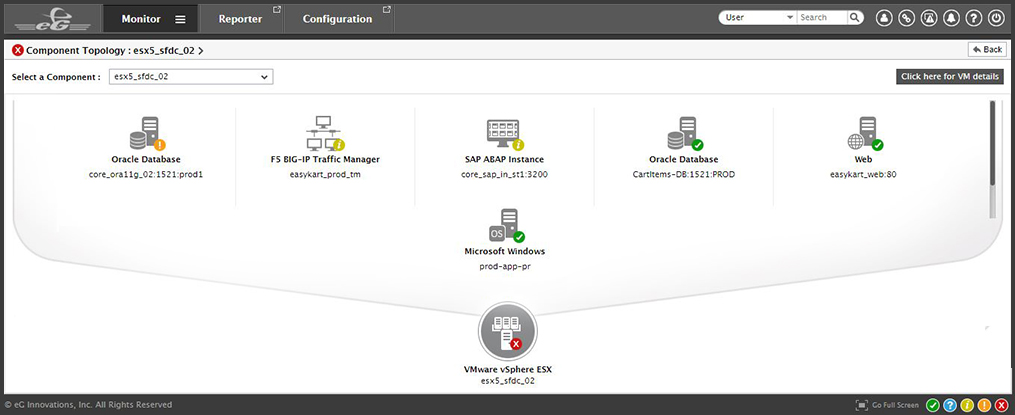
Application-to-VM-to-ESXi host mapping
Reports
eG Enterprise ships with many out-of-the-box reports for historical data analytics, VM capacity planning, VM sprawl analysis, and infrastructure right-sizing. Report delivery can be scheduled and automated via email.
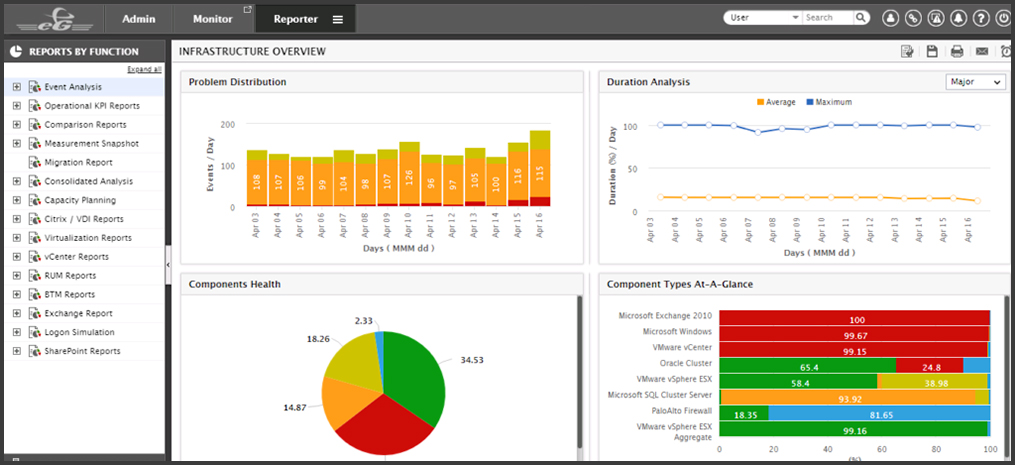
Infrastructure overview report
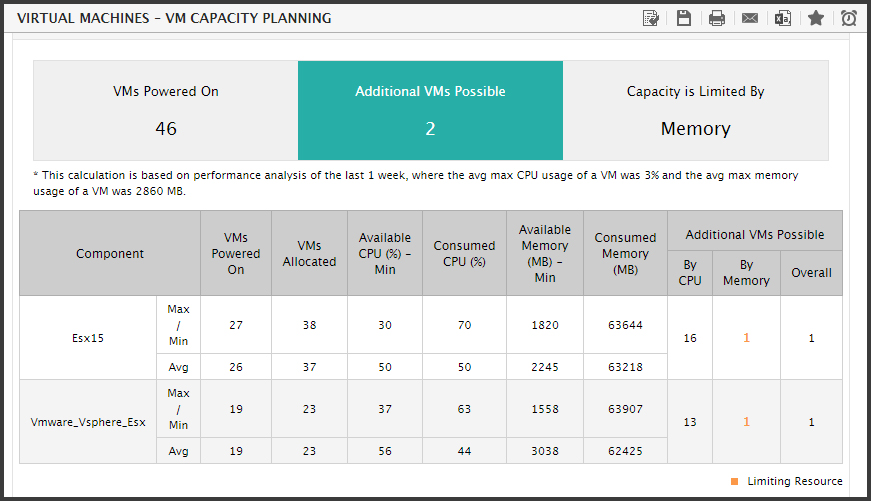
VM capacity planning report
Licensing
eG Enterprise for VMware monitoring is licensed by the number of hypervisors monitored and is not restricted by the number of virtual machines monitored or physical CPUs per hypervisor.
Going Beyond Virtualization Monitoring
In addition to VMware monitoring, eG Enterprise also has a wide range of options to monitor and manage performance for popular enterprise applications, including Microsoft SQL Server, Exchange, Oracle, and operating systems such as Windows, Linux, UNIX, etc.