Bottlenecks in the Linux OS configuration can affect application performance. Track application performance and correlate with server performance to identify bottlenecks and resolve them.
Free TrialTrusted by leading companies


Linux servers are widely used by many enterprises to power critical applications in their data centers. Applications ranging from infrastructure services to databases and web servers to critical applications like SAP and CRM systems are hosted on Linux servers. Slowdowns can result in frustrated users, loss of productivity and increased support costs for the enterprise.
When a Linux server slows down, administrators have to determine what is causing the slowdown: Could it be because of a hardware problem? Or could it be because of a malfunctioning application running on the server? Or could it be because the server is not sized correctly to handle the workload that it is seeing? If there is a bottleneck on the server, which resource is the bottleneck – is it CPU, or memory, or disk, or network?

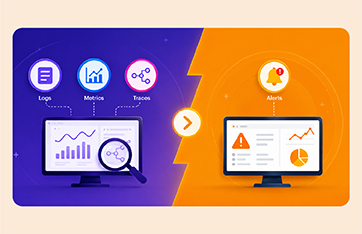
To be able to effectively monitor Linux servers, administrators need access to metrics from every layer of the server. They should be able to compare performance across these layers to diagnose exactly where the performance bottleneck lies.
And although server monitoring is important, administrators also need to be able to look in-depth into application performance. For example, a Java application running on a Linux server may be taking up all of the CPU resources and slowing down the performance of other applications running on the server. To diagnose this problem, it is important for today's Linux monitoring tools to show why Java application is taking up CPU – i.e., which thread, which method and which line of code is responsible for the CPU usage.
With eG Innovations, we are reducing system maintenance and support costs, avoiding incremental IT spending and eliminating system downtime across the hospital. Performance and prediction reports help us optimize IT spending and save $100,000 per year.![]()

eG Enterprise is a 100% web-based performance monitoring solution for Linux infrastructures. It includes out of the box support for all the different Linux variants including Red Hat Linux, SuSE Linux, Ubuntu Linux, and CentOS. Using a web-based console, administrators can track the status of their heterogeneous Linux server farms, receive alerts when problems happen, view reports on historical performance, and plan the capacity of their server farms.
To monitor a Linux server, eG Universal Agent can be deployed on the server in a matter of minutes with very little configuration required. Agentless monitoring is also supported. Administrators can choose the servers to be monitored with agents (e.g., critical production servers) and those that can be monitored in an agentless manner (e.g., staging servers). Key features:
To monitor server hardware, eG Enterprise integrates with native hardware monitoring tools from all major hardware vendors – IBM, HP, Dell, and more. Every aspect of operating system performance – including the usage of key CPU, memory, disk and network resources are tracked, plus system logs.
The same agent that monitors the Linux server operating system can also be used to monitor applications running on the server. Apache web servers, Java application servers like JBoss, Tomcat, MySQL databases, etc., as well as commercial applications such as Oracle database servers, WebLogic or WebSphere application servers, SAP and more can also be monitored using eG Enterprise. For a complete list supported platforms, see "All Technologies."

eG Enterprise uses a unique layer model representation to depict the performance of different layers of a Linux server (e.g., hardware, operating system, network, TCP/IP, application processes, etc.). A similar layer model representation is also used for other operating systems that eG Enterprise supports. This way, eG Enterprise provides a single pane of glass from where administrators can monitor multi-vendor data center servers from a single console and with a unified representation model. This greatly simplifies the monitoring and management of heterogeneous server farms.

Baselines for all the key metrics are pre-defined in eG Enterprise based on industry standard best practices. eG Enterprise can also determine automatic thresholds for other metrics based on an analysis of past history. The actual metrics are compared with the thresholds to determine where the problems lie in the infrastructure.
With eG Enterprise in place, Linux administrators can start receiving alerts when a key process fails, a critical event is logged in the server log, or when a disk fills up.
eG Enterprise also provides extensive web-based reporting of all the collected metrics. Admins can receive periodic, detailed reports of the performance of their server farm without even logging into the console.