Introduction: Real User Monitoring is Business-Critical
Near-instantaneous performance. Silky smooth user experience.
This is what your digital users are expecting from your web application. If they perceive slowness or encounter failures in their user experience, they will readily switch to a competitor.
Failures are a fact of life. The SRE (site reliability engineering) movement is helping craft modern digital systems that are engineered for resilience to failures. However, the key is for you to discover and fix those failures before customers are negatively impacted.
Real user monitoring can help you do precisely that – uncover web application failures and bottlenecks before customers notice them. Real user monitoring is a great fit for monitoring full-stack microservices applications and is the ideal starting point for answering the key IT performance monitoring question: “Why is my application slow?”
This article is not just for SREs or IT support. Ensuring a great user experience is a team sport.
Stakeholders across the organization – SREs, IT Operations, developers, helpdesk and support staff, webmasters, business and product owners can derive incredible value in a real user monitoring tool. Real user monitoring is a mission-critical tool for every modern digital team.
A solid grounding on the why, what, and how of real user monitoring can help you make informed decisions on your digital monitoring strategy. In this article, you will learn:
- A definition of real user monitoring and how it fits in with other monitoring tools
- Why SREs need real user monitoring as part of their overall observability toolbelt
- A checklist of user experience questions that real user monitoring helps answer
- How real user monitoring is implemented
- Benefits and limitations of real user monitoring
What is Real User Monitoring – A Definition
Real user monitoring (RUM) is a passive performance monitoring technique that allows you to see your web application performance from the point of view of a real end user.
Let’s break that definition down:
- Passive: The key word “passive” suggests that it is the opposite of proactive monitoring (i.e. synthetic scripted record and playback). Synthetic monitoring actively emulates a custom user experience by scripting browsers that navigate your website by taking specific actions and check that specific elements are present on the page. In contrast, RUM sits back and analyzes all “real” user requests in business applications.
- Real end user: The focus is on actual end users. Real user monitoring analyzes the user journey (also known as click path) of an actual user and captures each user action. These actions could be submitting a form or clicking a menu item.
- Web application: RUM can analyze the performance of web applications that could range from traditional web pages to modern SPA (single page applications).
RUM and Digital User Experience – The Gartner Angle
Gartner defines Digital Experience Monitoring (DEM) as a composite of two pillars: Real User Monitoring and Synthetic monitoring.
Synthetic monitoring and RUM have a symbiotic relationship. To learn more, visit Synthetic Monitoring vs. Real User Monitoring.
SREs Need to Start With Measuring Real User Experience – Speed and Quality
When someone says “SRE” (Site Reliability Engineering), the term conjures up images of people watching server health graphs on a wide-screen dashboard and responding to pager alerts. These are important but what’s of the highest importance for SREs is to build reliable systems that deliver a great user experience.
SREs ensure that the infrastructure and applications features are designed in a way that supports specific SLO (Service-Level Objectives). SLOs are metrics that are formally agreed by SREs with the business and measure what your internal and external customers really care about: speed and quality. Real user monitoring is a great barometer for both speed and quality.
Site reliability engineering as a philosophy is all about delivering business results – better customer retention and high user satisfaction through solid and reliable systems. RUM is a vital tool for SREs to start at the top with measuring the actual user experience and then working their way down the stack to find failure points in the full-stack application.
How RUM Fits into the SRE Observability Toolbelt
SREs monitor multiple “golden signals”. In the context of browser monitoring, they are as follows:
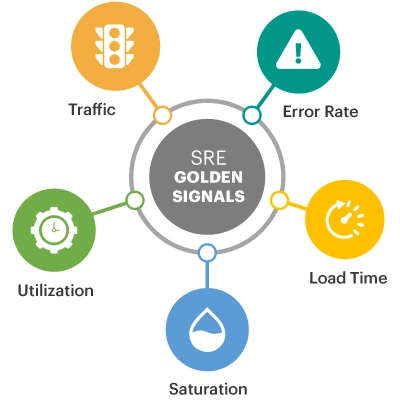 Request Rate/ Traffic — demand into the website in HTTP requests/sec.
- Error Rate — JavaScript code-level bugs or resources failing in errors/sec.
- Latency/Load time — end-to-end page load time, in milliseconds.
- Saturation — how overloaded or “full” your service is and as a result of which requests are queued. Examples include CPU run queue length or time spent waiting for a downstream connection.
- Utilization — how busy the resource or system is, expressed as 0-100%. Examples include CPU utilization % or disk utilization %.
Signals #1, #2 and #3 (i.e. traffic, frontend error rates and page load times) are best measured from the perspective of the end user using real user monitoring. The end user experience is the ideal starting point to subsequently drill-down into the server-side request rates, errors and latencies. SREs rely on a host of other tools ranging across APM (application performance monitoring), log monitoring and infrastructure monitoring to augment real user monitoring.
Real User Monitoring Gives You Visibility into the User and Business Journey
Users undertake a user journey (also known as business journey) with your web application. A user journey is a set of steps that a user takes to accomplish some goal on your service. Each step could have one more user event (such as filling a form and clicking the submit button). For example:
- E-commerce in retail: Product search, add to card, checkout, and payment.
- Loan approval in financial services: application, loan underwriting, decision, closing and post-closing.
- Patient lookup by a clinician in an electronic medical record system.
SREs track SLIs (Service-Level Indicator) such as API errors and latency for every critical step of the user journey. These SLIs ensure compliance with the SLOs agreed with business.
We’ll see later in this article why SREs need capabilities to get a full-stack view – a tool that connects the frontend (browser) performance to the backend (server) performance. SREs need tools that directly correlate the RUM frontend instrumentation with APM (application performance monitoring) server-side instrumentation. Most APM tools accomplish this automatically without needing any code changes on the frontend or the server-side. SREs can thus get a complete end-to-end from the browser to the data store for a full-stack application stitched seamlessly on a single pane of glass.
Key Takeaway: RUM is an important component of a holistic observability toolchain. RUM tools work in tandem with APM (application performance monitoring) tools to stitch the user journey on the frontend and the server-side as one holistic visualization and facilitate easy tracking of SLIs. Real user monitoring is a mission-critical tool in the SRE’s observability toolbelt.
Key User Experience Questions – A Checklist
SREs should be able to find quick and accurate answers to the following performance queries using real user monitoring:
- Traffic
- What are the traffic trends to your web site/web application? Is it abnormally high or low?
- Where do your heaviest loads originate?
- Which specific page groups in the web site/web application are seeing the maximum user traffic?
- Latency and Load time
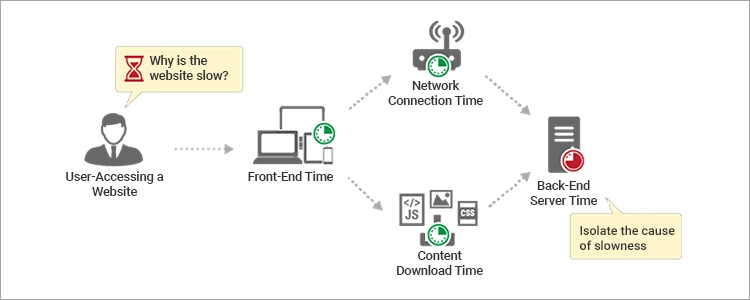
- Are the pages in the web site/web application loading quickly? If not, then what is causing the slowness – is it the network? front end? or backend?
- If the front end is causing page loading to slowdown, then what is the source of the slowness with the front end? – is it because of a delay in page rendering, DOM downloading, or in DOM processing?
- If the problem is with the network, then what is the exact network issue? – is there a delay in domain name resolution? Or is there a poor network connection to the server?
- Are users of a particular page group experiencing more slowness than the others? Which page group is it? Which pages in the page group are contributing to this slowness?
- Are the base pages loading swiftly? Are iFrames loaded quickly? Is AJAX code processed rapidly?
- User satisfaction
- How many page views have satisfied users in terms of page load time, and how many have not? Which are the slow pages, and where does the bottleneck lie?
- What is the Apdex score of the web site/web application? Is it satisfactory or not?
- Errors
- Have any pages encountered JavaScript errors? If so, which ones are they and what are those errors?
- 3rd party dependencies
- How are third-party APIs and dependencies impacting your web performance?
- Devices and geographies
- Which are the devices that are being used by users to the web site/web application? How many page requests are coming from each device?
- Are users using a specific device experiencing more performance issues than the rest? If so, which device is it?
- What are the browsers that are being used by users for the web site/web application? How does the experience of users vary with browser? Is any browser seeing more performance issues than the rest? If so, which browser is it?
- In which countries, cities, and regions is your web site/web application most popular?
- Are users connecting from a particular country, city, or region experiencing more slowness than the rest?
Different Ways of Implementing RUM
Real user monitoring can be implemented in different ways:
- Many applications capture and report user experience (for example, with Citrix access, ICA/HDX/EDT latency is captured for each user session)
- User experience can also be monitored by deploying agents on user terminals
- Network taps/probes can also be used to watch user interactions and report user experience
- For web applications, a common way of tracking user experience is using JavaScript injection
What is JavaScript Injection?
A small JavaScript code snippet is introduced in application web pages being served to clients. When each client downloads the application content, it also downloads and executes the JavaScript code snippet. This snippet reports details about the client (IP address, location, browser version etc.), the page being accessed (URL, query string, etc.) and the performance seen by the client (page load time, JavaScript errors, etc.).
How capable is JavaScript instrumentation?
JavaScript instrumentation can leverage a powerful collection of performance APIs that are supported by modern browsers:
- Performance & Performance Timing API: Measures all the timings that relate to the current page load.
- Navigation Timing API: Measures redirects, DNS (domain name system) look-ups, DOM (document object model) loaded, page loaded, etc.
- User Timing API: Provides us with methods we can call at different places in our app, which lets us track where the time is being spent.
- Resource Timing API: Measures loading of specific page assets such as CSS, scripts, images, and Ajax calls.
- Paint Timing API: Measures rendering operations observed during page construction:
- First Time to Paint: when the browser has painted the first pixel on the page
- First Contentful Paint: when the browser has painted the first item of DOM content, such as text or an image.
The ideal approach depends on the degree of control that you have on the end points, the network, the application, etc. For instance, if you are the application owner, it may be difficult for you to tap into the network or have agents on all the end points.
Key Takeaway: For most modern full-stack web applications, real user monitoring using JavaScript injection is the ideal implementation option.
The Six Steps of RUM: What RUM Should Encompass
Alistair Croll and Sean Power, in their well-regarded O’Reilly book Complete Web Monitoring, detail the six steps of RUM:
- Capture: The monitoring system captures Page objects, Ajax and IFrames from several sources—JavaScript on a browser, a passive network tap, a load balancer, or a server and its logfiles.
- Sessionization / User Journey: The system takes data about these hits and reassembles it into a record of the pages and components of individual visits, along with timing information.
- Problem detection: Objects, pages, and visits are examined for interesting occurrences—errors, periods of slowness, problems with navigation, and so on.
- Individual visit reporting: You can review individual visits re-created from captured data. Some solutions replay the screens as the visitors saw them; others just present a summary.
- Reporting and segmentation: You can look at aggregate data, such as the availability of a particular page or the performance on a specific browser.
- Alerting: Any urgent issues detected by the system may trigger alerting mechanisms.
When reviewing a product claiming to offer RUM, the six steps are often used as an evaluation checklist to categorize features and capabilities.
Modern RUM platforms based around AIOps technologies can learn about normal behavioral patterns of your services and users, automatically baselining expected performance and offer automated alerting when anomalous patterns or behavior are detected.
Benefits of RUM
RUM helps identify how page visitors are using a site or app and provides page metrics such as load time for analysis of a page, objects and even individual visits. Typical benefits include the following:
- Measure service-level objectives with real user experience: The idea behind SLO is that service reliability ultimately ensures end user happiness. As mentioned above. Service Level Indicators (SLIs) are the metrics used to measure the compliance with the SLOs. Examples include: availability, latency, errors and throughput. RUM captures these SLIs from the point of the end user – exactly how real customers experience your application in terms of traffic, errors and latency. These golden signals become a common language for conversations across cross-functional teams such as SRE, developers and business teams.
- Use a quantifiable score (Apdex) to measure user satisfaction: Application Performance Index, or Apdex, is an industry standard to measure users’ satisfaction with the response time of web applications and services. Think of Apdex as a Service Level Agreement (SLA) mechanism that measures the level of user satisfaction (or frustration).
Here’s how Apdex is computed:
[Satisfied requests + (Tolerating requests/2)]/Total samples
An Apdex score of 1.0 indicates that user experience was satisfactory. A score of 0.0 means that none of the responses were satisfactory. An Apdex score of 0.50+ indicates a “tolerating” user experience where users experience a moderate amount of lag. An Apdex below 0.5 indicates an unacceptable user experience.
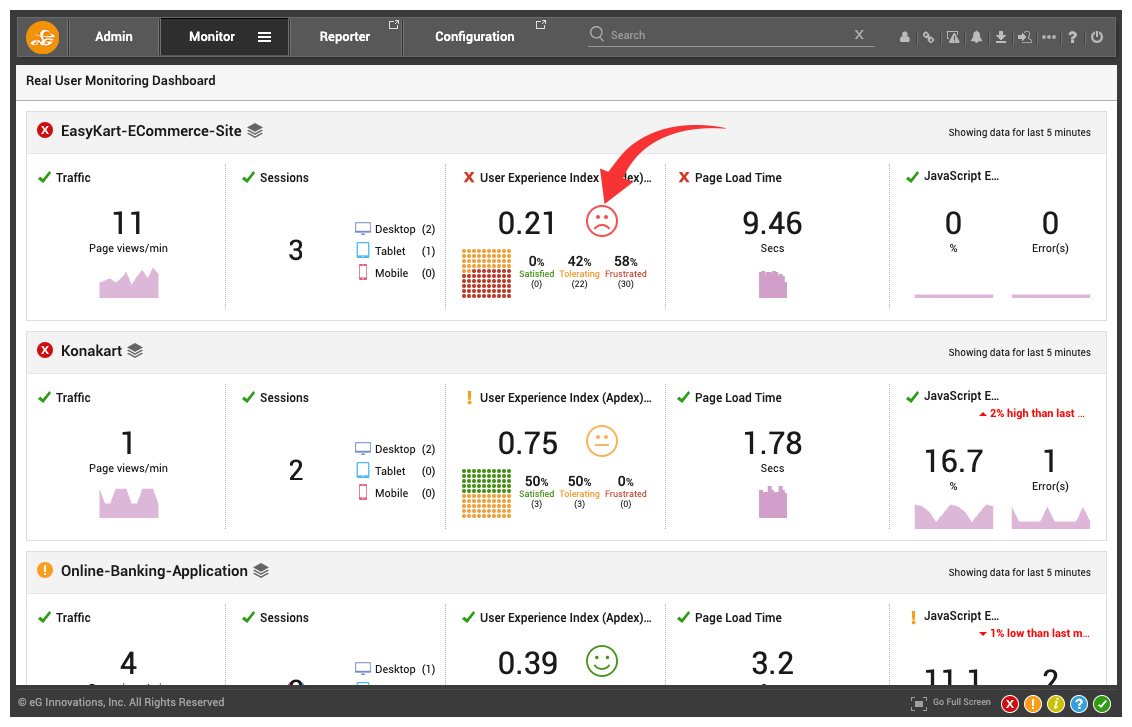
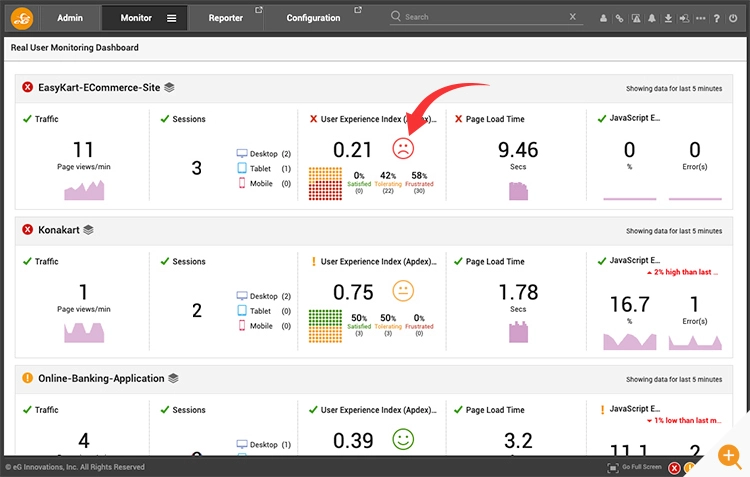 Figure 3: Apdex helps you prioritize troubleshooting. In this example, both Konakart and EasyKart are serving poor user experiences, but the EasyKart application needs immediate attention as indicated by the poorer Apdex score.
 - Correlate web performance with Business KPIs: RUM tools can add meaning and context to user sessions with business attributes such as User ID, email, or name to the extent your privacy rules allow you to collect data. In addition, you can capture business context information such as shipping ID or an item description.
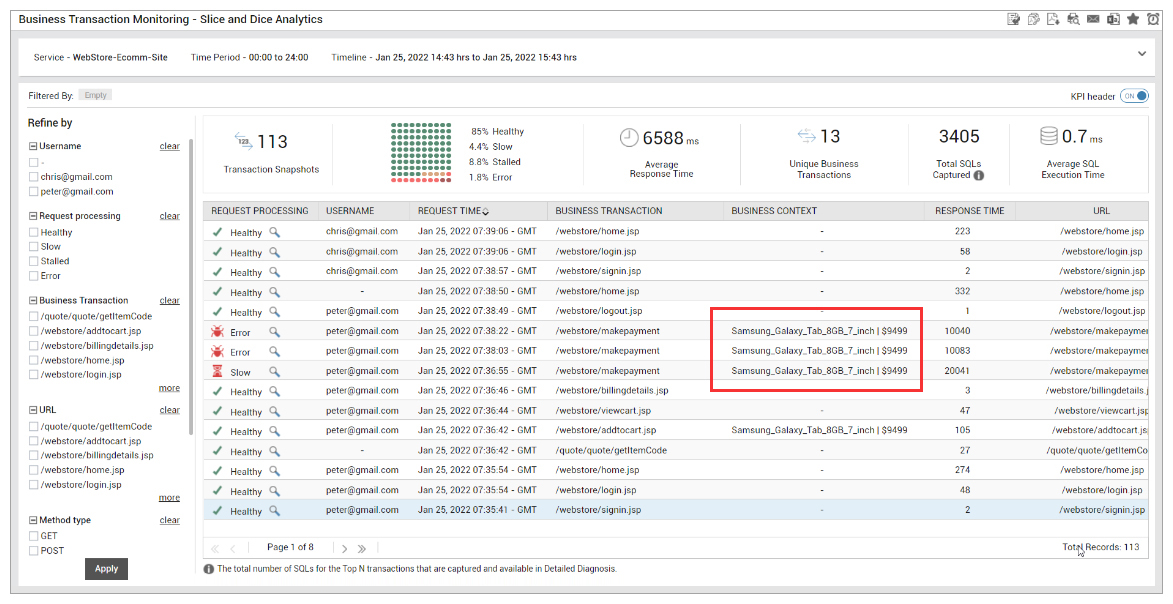
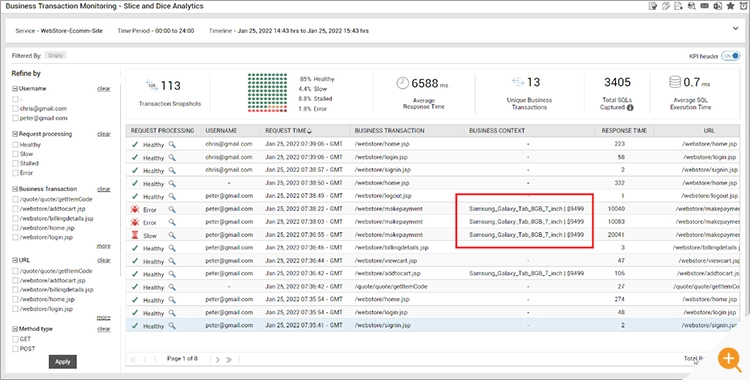 Figure 4: See business context information tagged to each real user action. In this example, you can see the specific cart items and the error status for the payment processing page.
Real user monitoring can give you the current baseline of quantifiable business metrics such as number of unsuccessful payments or aborted bank account creation process or cart abandonments. RUM dashboards on a LED screen can become a “watering hole“ for cross-organizational teams to gather around and discuss how to improve business metrics over time.
- Diagnose and triage quickly for quick MTTR (mean time to resolve): The root cause of slow systems could lurk in:
- the frontend browser code (such as ReactJS or Angular)
- the network (SSL/TCP handshake process)
- the server-side code and infrastructure
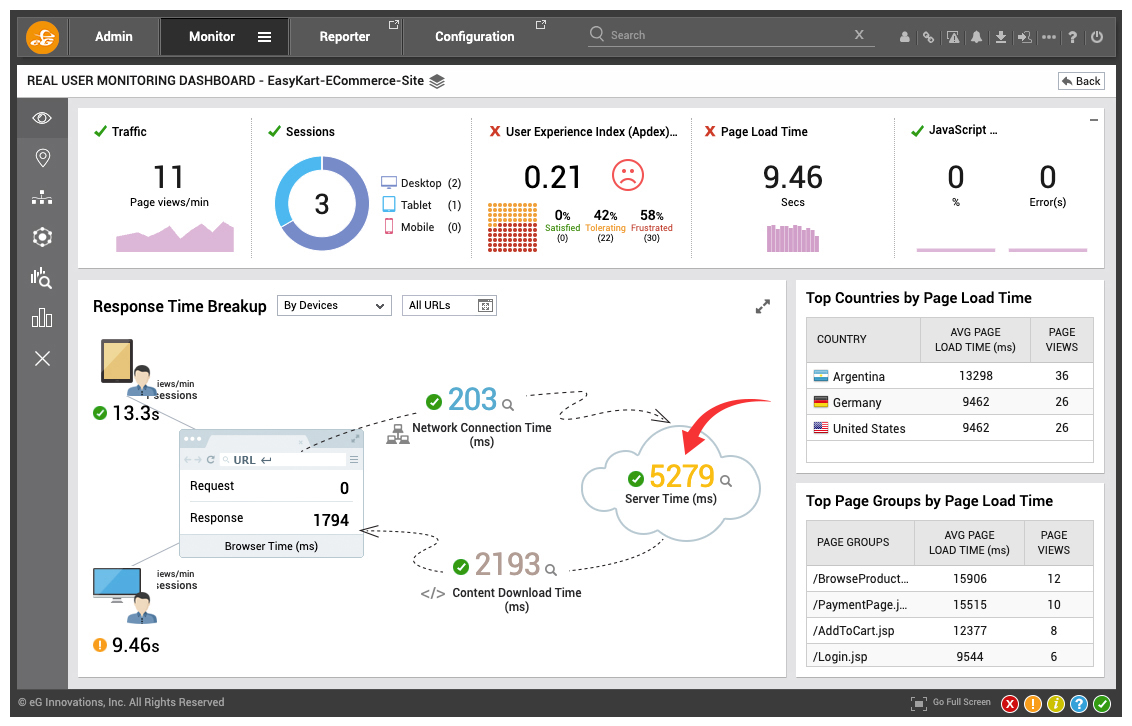
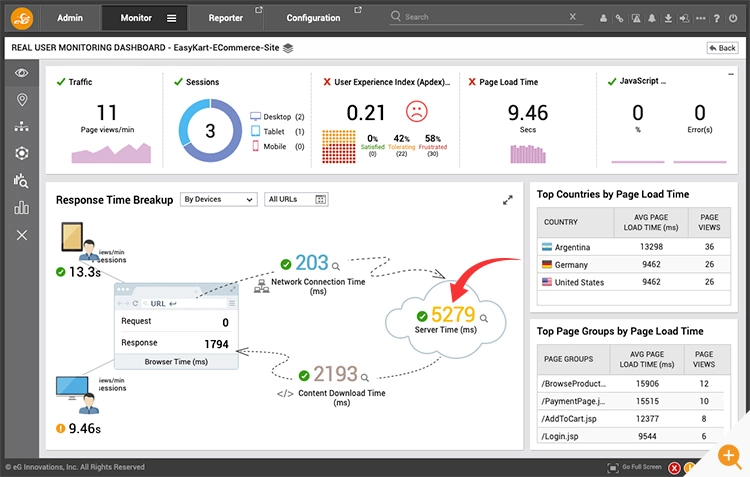 Figure 5: A user experience topology map can show you frontend vs network vs server-side performance. In this example, the server-side processing (5s+) is the root-cause for poor user experience.
One of the KPIs on which SREs are measured is MTTR (mean time to resolve). In war rooms, when root-cause is not clear, significant time may be wasted in guess work and finger pointing. SREs need the data to know what to investigate and who to call for joint troubleshooting when there is a slowness. Real user monitoring can pinpoint the specific trouble area as shown in the above dashboard shown in figure #5. RUM can also analyze historical data and tell you if this problem is intermittent in nature or if it is a systemic problem. Non-experts such as helpdesk staff can quickly and correctly route the ticket to the right teams for a fast resolution.
- Hold third-party vendors honest for their frontend code embedded in your site: Modern web sites leverage third-party services to gather business intelligence data or support application functionality (like social widgets or maps). These services come in the form of embedded JavaScript code that makes external calls directly from the browser client. If your end-user monitoring is incomplete, you will not see performance regressions introduced by slow third-party calls. As a result, the SRE might see excellent health in the services in the data center but a malfunction or glitch in third party frontend code might cause frustration in end user experience. This might result in transaction abandonment and revenue loss. RUM allows you to hold third party vendors honest for delivering top notch web performance.
- Captures user-centric web performance metrics: In addition to DOM (document object model) load time, RUM tools also capture user-centric web performance metrics like First Paint and First Contentful Paint (FCP), which are useful for understanding how the end user perceived the load time of the page.
- Discover JavaScript errors in real-time: Debugging JavaScript errors in a production environment can be a difficult experience. Most error reports are vague since end customers may lack the ability to convey the exact browser console log to support staff.
Developers need to get notified of JavaScript errors and the complete stack trace leading up to the error. Often JavaScript is minified and as a result, stack traces are of little use.
RUM tools can map the source maps to understand your minified JavaScript’s stack traces.
Similar JavaScript errors can be automatically grouped to reduce alert noise, and all errors can include detailed information such as time of error, which browser version, OS version etc.
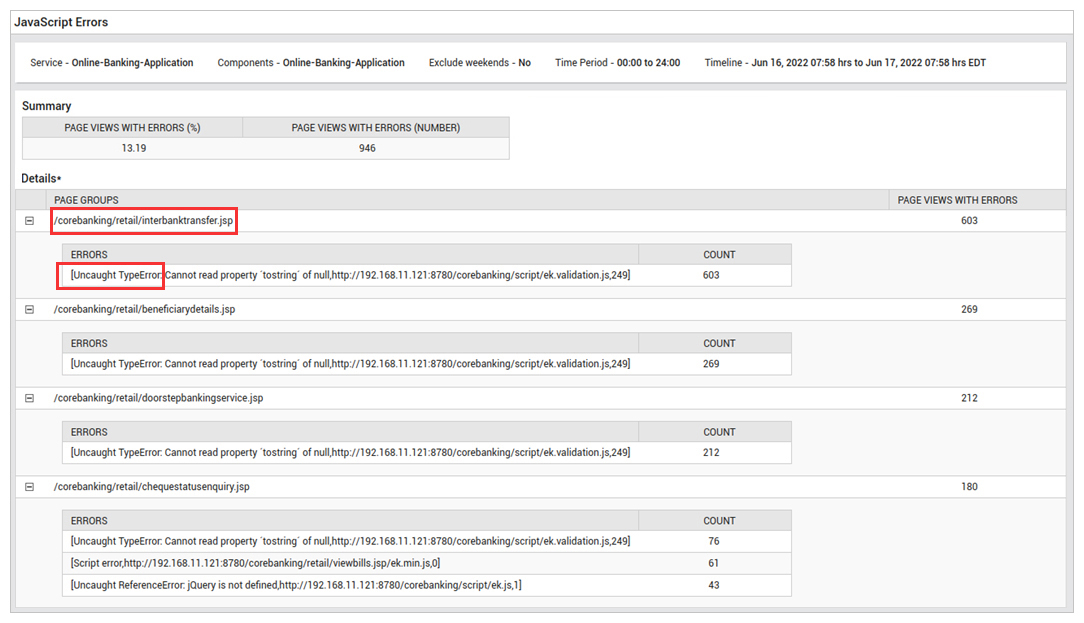
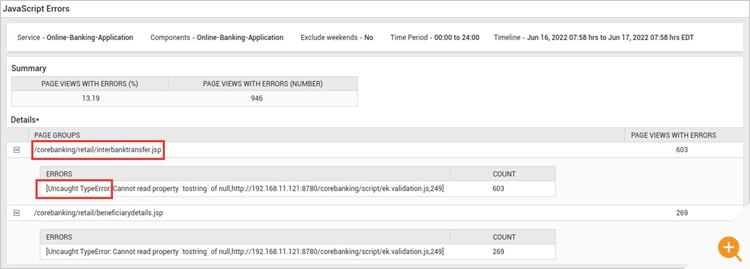 Figure 6: Developers need detailed actionable insights to resolve JavaScript errors. In this example, the “interbanktransfer.jsp” page needs an immediate fix to resolve the high number of TypeErrors since it is a critical business function.
 - Load Time Breakdown: If your visitors are experiencing slow page-loads or poor HTTP request performance, it’s often caused by the network, DNS servers, redirects, application performance, among other things. A clear distinction is needed between “actual work” vs “waiting” for downstream resources.
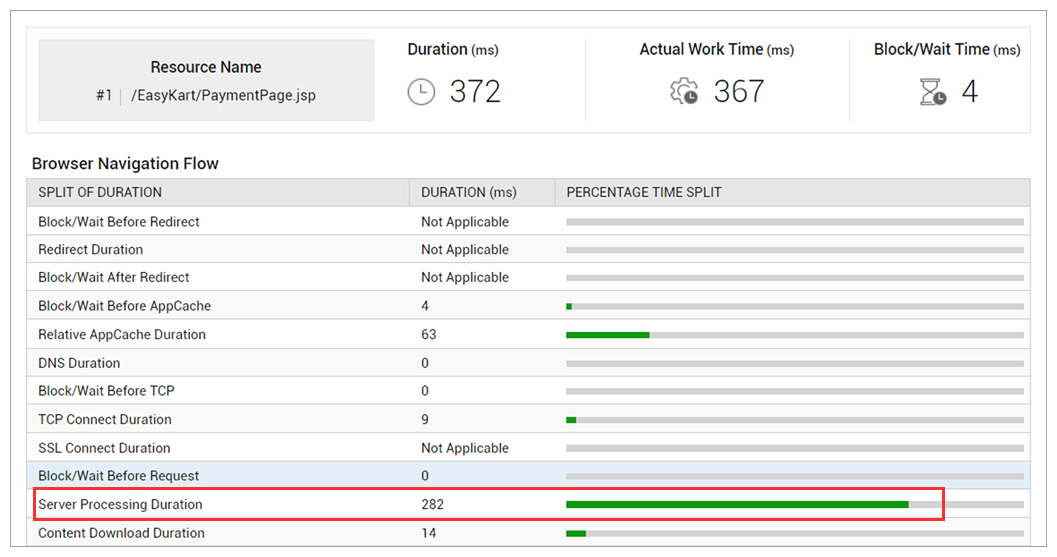
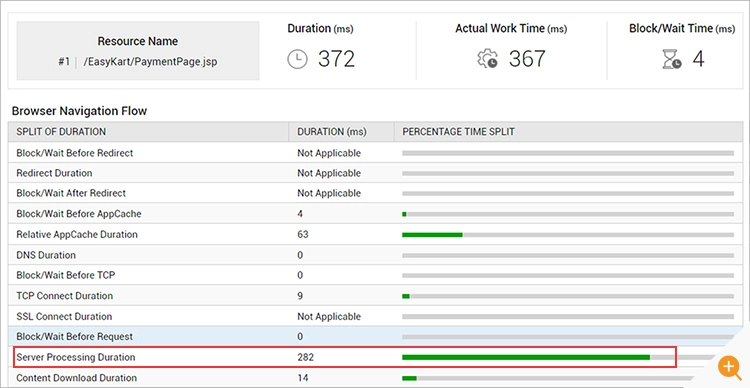 Figure 7: Developers need a clear distinction between action rendering time via-a-vis blocking or waiting time. In this example, the browser is waiting for the server-side response.
 - Web page resource insights: When a request to a web page is issued, the browser begins downloading resources such as images, stylesheets and JavaScript. In order to download these resources, the browser establishes a connection with the host. There’s a key bottleneck you need to be aware of – most modern browsers impose a limit of 6-8 connections per domain (assuming HTTP/1.1 is the protocol). This means that you can issue a maximum of 6-8 concurrent requests per domain. The rest of the resource requests will be “stalled” waiting for the browser to get to them. RUM can give you detailed information on “resource blockers” about each resource that was fetched while loading your website. This will allow you to use techniques such as domain sharding and image sprites to improve content fetch times.
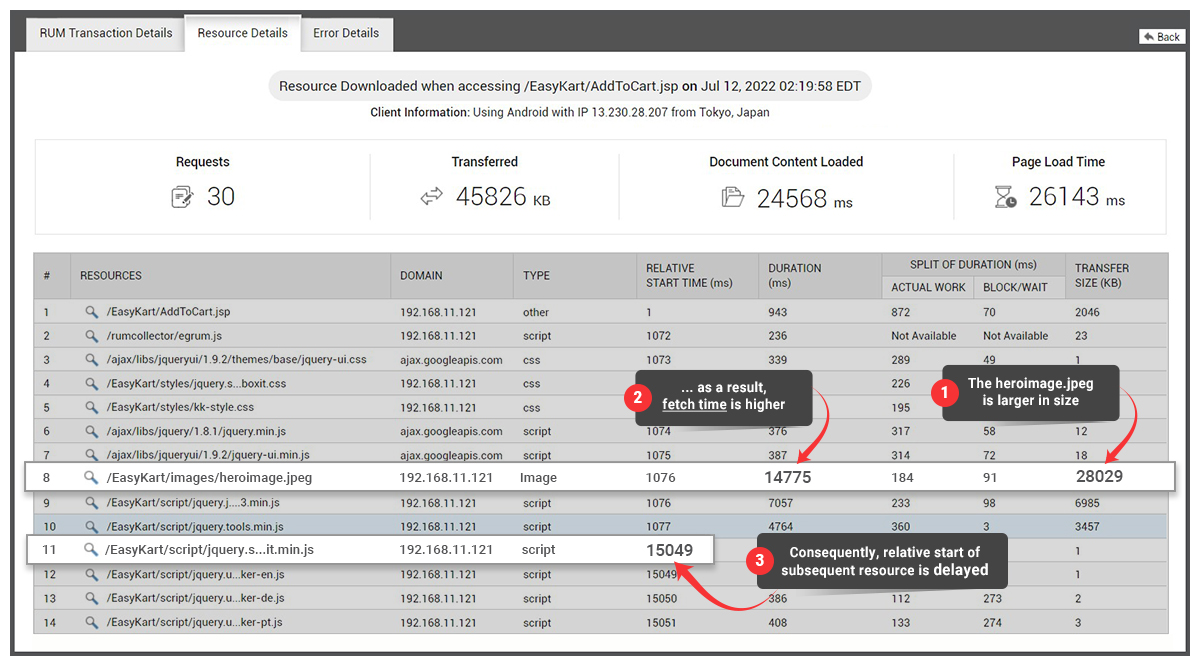
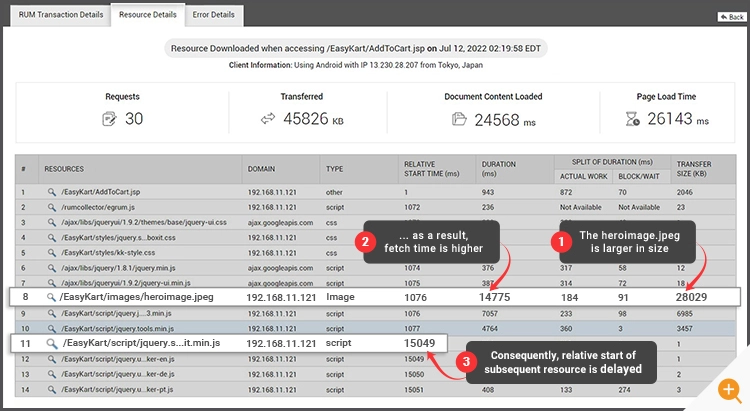 Figure 8: Developers need insight into blockers that impede fast browser rendering. In this example, the “heroimage.jpeg” which is larger in size is blocking other resources from getting downloaded as can be seen from the “relative start time”.
 - Omni-channel user behavior across different platforms: Product owners need comprehensive information to understand how end users interact with their applications. Customers can access your application from desktop browsers or mobile browsers on devices such as Android and iOS. For example, a retail customer might abandon their cart at the end of a shopping transaction. Without a complete view of the interaction, product owners may find it challenging to pinpoint why users did not complete the transaction. Integrated RUM and APM tools can pinpoint the exact component that caused the delay, taking the guesswork out of problem solving.
- Performance trends across geographies: Real user monitoring tells you where your users are. Is the problem local to certain geographical locations or is it widespread across a geography?
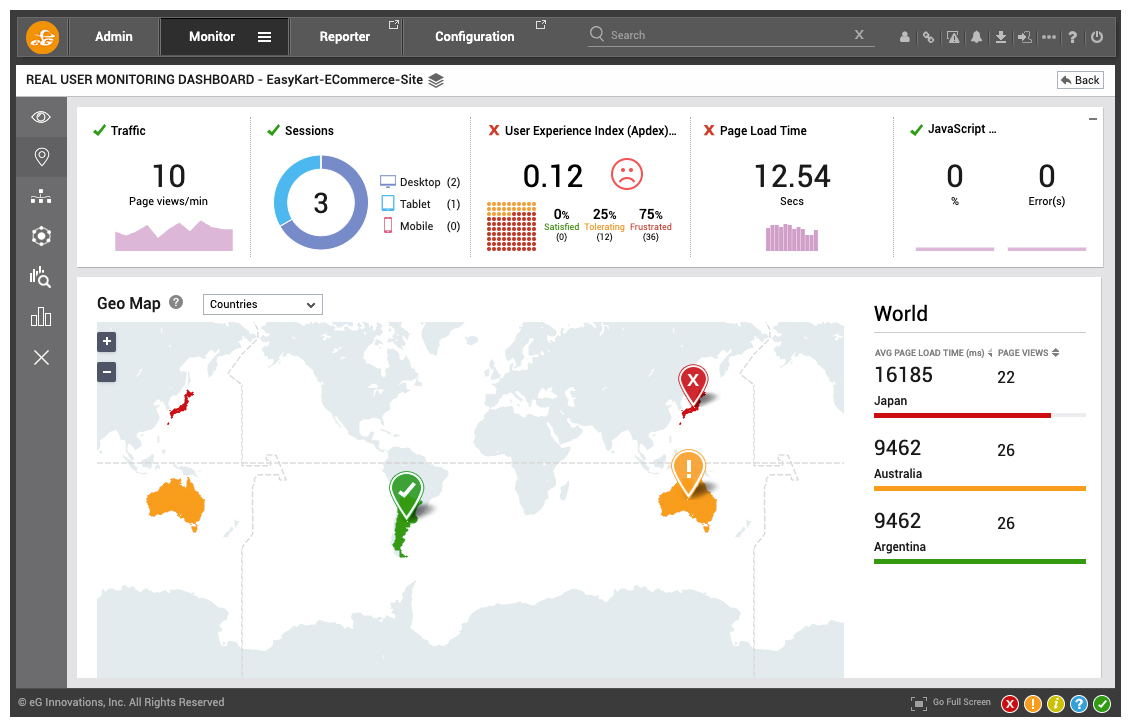
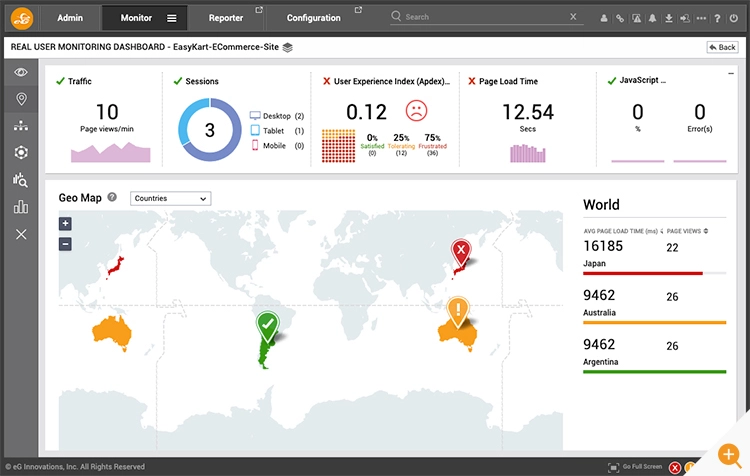 Figure 9: Location markers can accurately pinpoint number of page view requests correlated with page load time. In this dashboard, user experience from Japan and Australia is equally poor but the problem is acute in Japan.
 - Empower your helpdesk: When an irate customer calls your call center, support teams are often at a loss to pinpoint the root cause. RUM tools can tag the user ID and provide a search facility to pull up the entire chain of requests in the user journey that led to the user frustration. This is useful regardless of the nature of the application – whether external facing internet applications such as e-commerce or internal intranet applications such as payroll or HR systems. Non-expert communities such as helpdesk operators are empowered with the new user context offered by RUM.
- Improve employee experience: RUM is often considered in the context of external and customer facing sites but is widely used in organizations to ensure their own employees can work effectively. By monitoring the real user experience of enterprise applications such as Microsoft Dynamics, SharePoint, Office 365, Atlassian Confluence, and PeopleSoft, and custom web applications built on Java, .NET, Ruby on Rails, Python and PHP, organizations can ensure satisfied and effective employees and avoid internal help desk tickets.
Limitations of RUM
- No insights when there are no users: RUM is of limited help when there are no real users and offers limited data when there are low volumes of users. It’s very common for issues to occur when there are a low number of users overnight that become apparent at the start of office hours in the morning.
For example, branch banking systems accept customer walk-ins from 8 am in the morning. Performance problems could happen during start of business. Synthetic monitoring is usually the main technique used to overcome this fundamental limitation. We talked earlier about the symbiotic relationship between synthetic monitoring and RUM and this is a good example of how they work well with each other. - High volume and high velocity data: As user volumes grow, a large amount of data to process and analyze is generated. Modern monitoring platforms such as eG Enterprise are usually built around powerful AIOps (Artificial Intelligence for Operations) engines leveraging machine learning technologies designed to process and analyze data at scale and so this limitation is one that can be avoided by a wise choice of enterprise grade solution.
- Lack of competitive benchmarking: RUM can measure your own site’s performance but you need other tools to examine your competitors’ websites and their performance. Tools such as WebpageTest can fill this visibility gap to an extent.
- Lack of root-cause diagnosis: Without identifying the reason for problems RUM identifies, it is impossible to have a path to resolve and eliminate issues. Identifying the underlying cause of slowness, performance issues, errors and so on is often beyond historical and simple RUM tools. However, modern RUM platforms such as eG Enterprise will include automated alerting and root-cause diagnostics. Ideally, RUM platforms need to correlate user experience issues with business transactions, application performance, and underlying infrastructure for root cause analysis.
Conclusion: Beyond RUM to Full-stack Monitoring
Real user monitoring records all real user actions and provides analytics to answer the vital question: “Why is my web application slow?”. The root-cause of slowness could be spread across multiple domains – frontend, server-side, network, content payload etc. To ensure end-to-end performance, site reliability engineers and IT operations need to go beyond RUM to get insights into the full-stack performance.
- Automatic code instrumentation: If your tool needs you to change application code in order to monitor and measure application performance, that isn’t ideal. Manually changing code is error prone and can introduce bugs. Tools like eG Enterprise automatically instrument the full-stack application across frontend and server-side by leveraging automation to not require manual code changes.
- Auto-discovery: Your modern applications deployed on containers and the cloud are dynamic. Container instances and cloud virtual machines come and go based on auto-scaling. eG Enterprise can automatically detect all applications, web services, processes, and infrastructure components from the start (as well as keep up with dynamic changes) and present them on an end-to-end service topology map.
- Distributed Tracing: Once you have auto-instrumented your application, the APM software can tag-and-follow requests as they flow through across distributed system/ microservices boundaries to monitor, debug, and optimize services.
- End-to-end APM/ Observability: Implement observability [logs, metrics, traces and events] across the full application stack so SREs can co-ordinate across IT teams to fix performance issues in near-real time.
Key Takeaway: Go beyond real user monitoring. RUM data leveraged within a complete monitoring platform should eliminate downtime arising from scenarios such as:
- Application faults arising from coding errors
- Slow or failed requests to on-premises databases or cloud hosted database services
- Overloaded resources such as CPU, Network bandwidth, memory and storage
- Latency issues, slow performance in transactions or remoting protocols
- Third-party services on which your services depend (such as DNS and payment gateways)
Extend your toolchain to Application performance monitoring (APM) that works in tandem with RUM and synthetic monitoring together with transaction tracing, log and error data, and infrastructure metric monitoring. By correlating data from all these sources, it is possible to improve performance, fix bugs, reduce downtime, and improve the end users’ digital experiences.

eG Enterprise is an Observability solution for Modern IT. Monitor digital workspaces,
web applications, SaaS services, cloud and containers from a single pane of glass.
Further Reading
- Synthetic Monitoring vs. Real User Monitoring (RUM)
- What is Proactive Monitoring and Why it is Important
- Learn a little about the eG PHP Transaction Profiler: The eG PHP Transaction Profiler
- Explore RUM Dashboards: The RUM Dashboard (eginnovations.com) and the type of overviews available to organizations adopting RUM
- Why is My Website Slow and What is the Root Cause? (eginnovations.com)
- Understand how AIOps platforms overcome the traditional scaling issues with RUM by leveraging machine learning technologies to process every single user transaction at scales beyond a human operator: AIOps Tools – 8 Proactive Monitoring Tips | eG Innovations
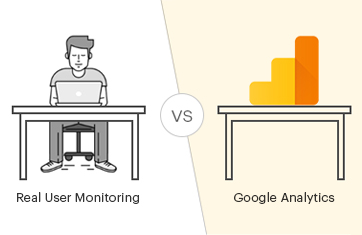
- Google Analytics vs. Real User Monitoring Tools | eG Innovations
 Arun is Head of Products, Container & Cloud Performance Monitoring at eG Innovations. Over a 20+ year career, Arun has worked in roles including development, architecture and ops across multiple verticals such as banking, e-commerce and telco. An early adopter of APM products since the mid 2000s, his focus has predominantly been on performance tuning and monitoring of large-scale distributed applications.