Distributed tracing is a method used in distributed systems to trace the path of an application request as it travels through different services and components – from frontend applications to middleware to backend services and database servers.
In a distributed system, a single request may be processed by multiple microservices. With distributed tracing, often without making any changes to your application code, each service records information about the request as it passes through, including timestamps, the name of the service, and any relevant metadata. This creates a trace, which is a step-by-step log of the request's journey through the system.
Some distributed tracing platforms require manual instrumentation or code modification to start tracing requests. Regardless of the method, a tag-and-follow approach is used for application transaction tracing. A unique identifier remains associated with the transaction throughout its interactions with microservices, containers, and underlying infrastructure.
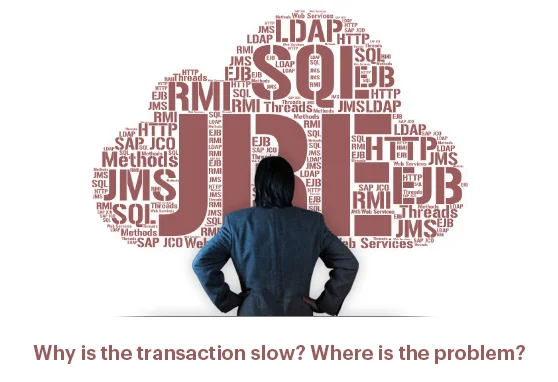
Distributed tracing can identify bottlenecks and the root cause of slow performance
As a result, you get insight into the user experience, through the highest levels of the stack down to the application layer and the foundational infrastructure beneath the applications.
Distributed tracing provides visibility into how a request flows through a distributed system and helps identify performance issues, bottlenecks, and errors. With distributed transaction tracing, without making any changes to your application code, you can see slow methods, slow HTTP calls, slow database queries, exceptions in your code, etc. By analyzing the trace, developers can pinpoint where a request is spending the most time, identify areas for optimization, and troubleshoot issues quickly.
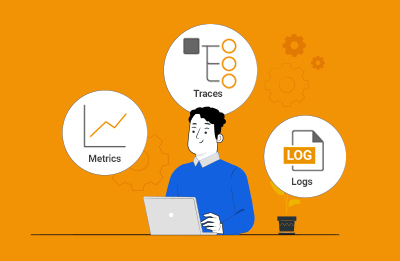
Distributed tracing is often used in conjunction with other observability tools, such as logging, error analysis, event monitoring, user experience monitoring and metrics, to provide a more comprehensive view of a distributed system's behavior.
To understand the relationship between traces and other signals such as metrics and logs, please see: The Three Pillars of Observability: Metrics, Logs and Traces (eginnovations.com).
In distributed tracing, tags and follows are mechanisms used to correlate and trace the flow of requests across various components and services in a distributed system. Distributed tracing follows an interaction and tags it with a unique identifier. This identifier stays with the transaction as it interacts with microservices, containers, operating systems and infrastructure. The processing times of these uniquely identified requests are noted at each tier of the delivery chain and this information is then used to present simple views to developers, clearly highlighting where the application bottlenecks are. Let's take a closer look at what tags and follows mean in this context:
By leveraging tags and follows in distributed tracing, developers and IT teams gain visibility into the behavior and performance of a distributed system. They can analyze trace data, identify bottlenecks, pinpoint latency issues, and troubleshoot problems. Tags provide valuable context and metadata, while follows establish the causal relationship between spans, enabling end-to-end traceability across the system.
The use of distributed tracing has grown in parallel with the rising usage of microservice architectures, and large-scale cloud (or even multi-cloud) systems and services. In modern software architectures, applications are often composed of multiple services and components that interact with each other to process user requests. These distributed systems bring numerous advantages, such as scalability, fault tolerance, and flexibility. These modern IT architectures introduce challenges when understanding how distributed components work together and identifying performance bottlenecks or issues.
Modern IT systems are designed to scale-up / scale-back with demand and have built in redundancy and failover. Load balancers, multi-component clusters of servers and other modern architectures mean that a request for a webpage and the pages delivery may take a vast number of different paths through a system.
Distributed tracing addresses these challenges by capturing and visualizing the flow of requests as they traverse through the specific services and components of a distributed system. By providing detailed visibility on individual request traces, tracing allows for in-depth analysis of latency, performance bottlenecks, and error propagation. It helps answer questions such as:
The common use cases for distributed tracing include:
While distributed tracing is a powerful technique for monitoring and analyzing the performance of distributed systems, there are some limitations to what it can do. Here are some scenarios where distributed tracing may not be enough:
Limited to backend coverage: Many tools do not take an end-to-end approach to distributed tracing and only generate a trace ID for a request when it reaches the first back-end service, losing information pertaining to the user session on the frontend.
Modern tools will include frontend services allowing easy routing of issues to the frontend vs the backend teams as appropriate.
In some cases, other monitoring techniques may be needed in addition to distributed tracing to fully understand the performance of a distributed system. These techniques may include log analysis, metrics monitoring, and synthetic testing.
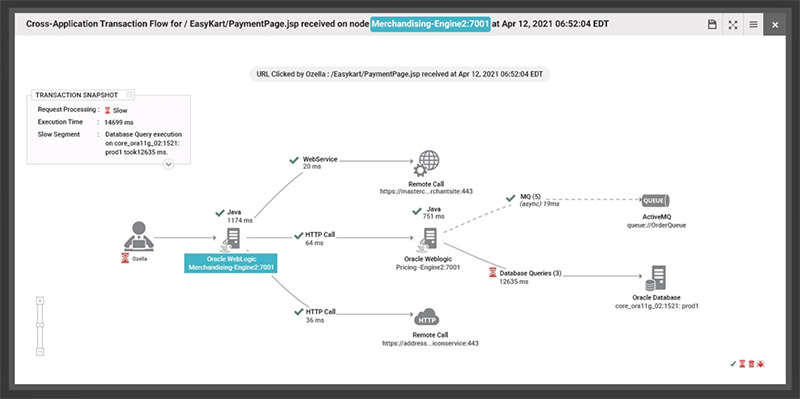
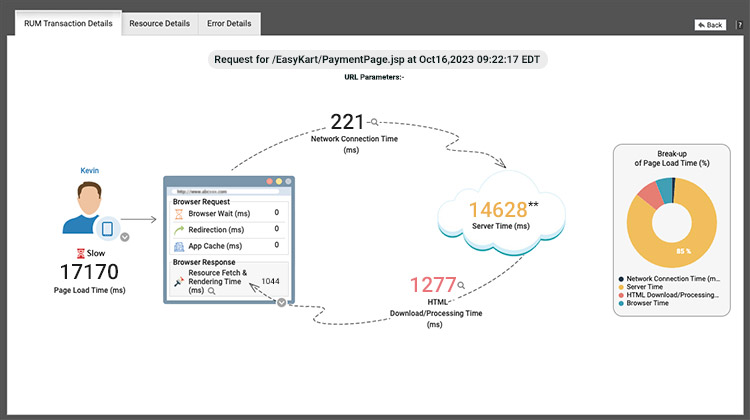
Yes, in some products such as eG Enterprise code-level visibility is possible. Distributed transaction tracing with eG Enterprise helps application managers track and follow every user transaction from any device (web and mobile). Using byte-code instrumentation, eG Enterprise auto-discovers the URLs being accessed by users, tracks the time taken for the server to respond, and alerts when slowness is detected. A transaction flow map helps to visualize the different stages of transaction processing.
Using distributed transaction tracing, you can easily pinpoint the exact line of application code that is taking high processing time and causing slowness. Additionally, you can also detect if there are any slow queries to the database that are causing slowness or any slow third-party calls. This capability is currently available for Java and .NET web applications. Transaction tracing for Node.js and PHP are also supported.
Distributed tracing can also be a powerful tool to proactively optimize problematic or inefficient code within applications and services.
Application Performance Monitoring (APM) and distributed tracing are two distinct but related concepts that play useful roles in understanding and monitoring application performance.
Distributed tracing focuses on tracking the flow of individual requests as they traverse through various services and components within a distributed system. It provides a detailed, end-to-end view of request traces, capturing latency, dependencies, and contextual information at a granular level. Distributed tracing helps analyze the performance characteristics of each request and identify bottlenecks or issues within specific spans or components. Tracing is a technique to follow the request path as it traverses application boundaries across layers and tiers. Traces are one telemetry type. APM uses traces along with other telemetry types such as metrics and logs to provide observability, see: The Three Pillars of Observability: Metrics, Logs and Traces (eginnovations.com).
APM provides a broad view of the overall performance and behavior of an application or system. It captures metrics such as response times, error rates, and resource utilization, offering insights into the health of the entire system or specific components.
Beyond application metrics, some APM tools can also provide host, infrastructure, and network metrics. This means that administrators can become aware of anomalous behavior and the warning signs of potential issues e.g., increasing server CPU or handle queues before users are impacted allowing them to stay ahead of any potential performance issues and proactively resolve them before users and transactions are actually impacted or experience performance issues or failures. Distributed tracing typically detects issues that have already arisen, and users are probably already experiencing issues.
There are many popular, widely used tools for implementing distributed tracing in distributed systems, including - OpenTelemetry, Jaeger (originally developed by Uber), Zipkin, AWS X-Ray (a managed tracing service provided by Amazon Web Services (AWS)), Dynatrace, Datadog and of course eG Enterprise.