The original review was published on TechGenix: http://techgenix.com/eg-enterprise-review/.
Read on to find out why Brien says:
If you have ever had to troubleshoot an application performance problem, then you know that doing so is no small feat. Most of the time, it seems that after hours of troubleshooting, you find that the problem is not where you expected it to be. Given how complicated it can be to troubleshoot application performance problems in complex enterprise environments, I decided to take a look at a troubleshooting tool called eG Enterprise.
eG Enterprise is based on the idea that there are many different factors that contribute to an application's overall performance. As such, the tool performs converged application and infrastructure monitoring in an effort to achieve root cause diagnostics. In other words, the software not only looks at the end-user experience and the overall application performance, but it also examines the underlying infrastructure's performance.
What is more impressive is that the software is able to detect code-level issues in Java and Microsoft .NET applications (which means that it can monitor your custom applications too). eG Enterprise also has native support for monitoring over 180 commercial applications, 10 operating systems, 10 virtualization platforms, 20 storage device types, and any SNMP-enabled network device.
eG Enterprise is designed to monitor all aspects of the end-user experience. It does this by using both synthetic monitoring and real user experience monitoring. Synthetic monitoring works by emulating a user session through scripted logins and other activities (such as reviewing a catalog, adding an item to the cart, etc.) This type of monitoring is useful for proactively detecting problems that can happen outside of business hours.
Real user experience monitoring tracks actual user transactions on web applications in an effort to gauge the user's overall experience. The process uses JavaScript injection technique that is very similar to how Google Analytics works for tracking website hits. Unlike Google Analytics, eG Enterprise is more concerned with capturing performance data from user's web browsers. For this to work, a small JavaScript code snippet must be introduced into your web application's pages. This can be done without seeking an application developer's help – web servers, load balancers, etc. provide the means to inject JavaScript snippets into web application content. The JavaScript code, which is downloaded by the client browser, assesses performance metrics on the client side and then sends a beacon to an analytics engine where the data is aggregated and analyzed. Real time data visualizations are then displayed to IT managers through a dashboard interface.
Even as helpful as real user experience monitoring can be, eG Enterprise's real strength lies in its root cause diagnostic capabilities. If you look at the screenshot below, you can see that eG Enterprise has been configured to monitor two different applications. The status icons next to the applications indicate that an application called Easykart is having some problems.
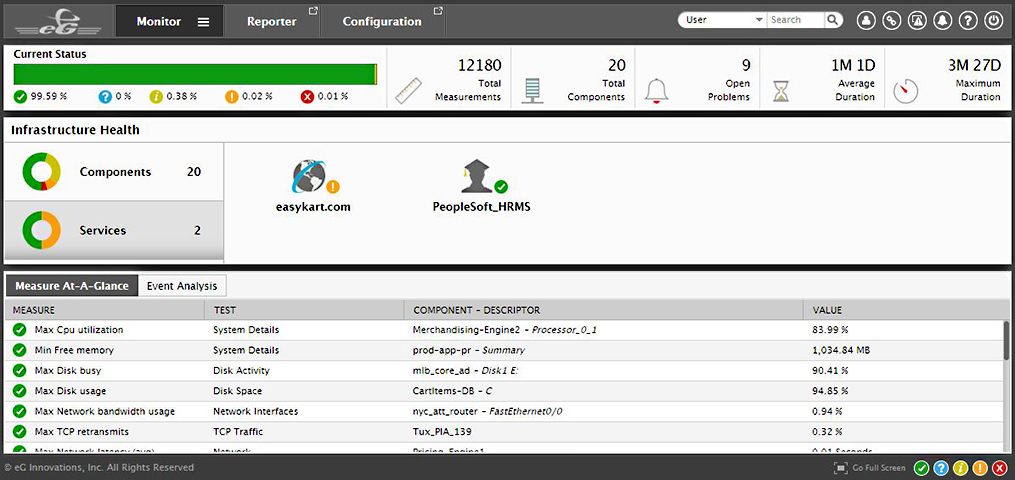
eG Enterprise web-based monitoring console.
When I clicked on the application, I was taken to a screen containing several different tabs. The next screenshot below shows the User Experience tab. This screen shows what the real user experience has been over the last hour. Notice in this screenshot that the user experience is quantified as either Satisfied, Tolerating, or Frustrated. In this case, 84 percent of the users are frustrated.
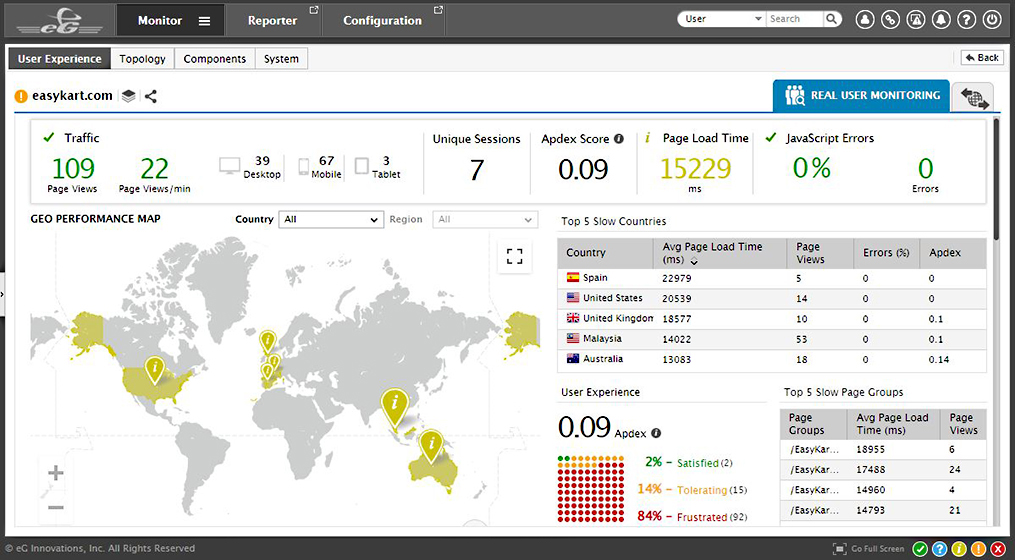
Monitoring the real-time digital user experience and page load time.
eG Enterprise quantifies users' experiences based on location as well. In this case, the users are seeing poor performance regardless of where they are located. This means that I can rule out any sort of regional connectivity issue.
One of the really nice things about eG Enterprise is that it allows you to drill down into the end-user experience. As you can see in the screenshot below, the Real User Monitoring Transaction Details screen is showing that a particular user is experiencing slow page load times. By using Real User Monitoring (RUM), the software breaks down the page load time into browser time, network time, server time and content download time and is able to see how long each step in the page load process is taking. In this case, the user is seeing slow performance because a back-end server is taking too long to do its job.
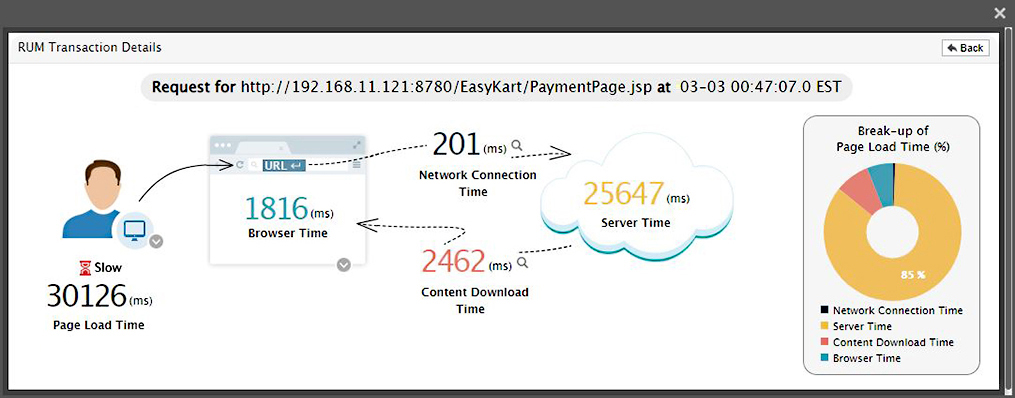
Page load time breakdown into network, server, browser, and content download time.
Since the user experience pointed to the server as the source of the problem, I clicked on the Topology tab. As you can see in the next screenshot below, eG Enterprise displays a topology map. The important thing to note about this map is that it is not a generalized view of the organization's IT infrastructure, but rather a map of the IT components that are being used to run the Easykart application. The topology view provides the health status of each item that is listed on the map.
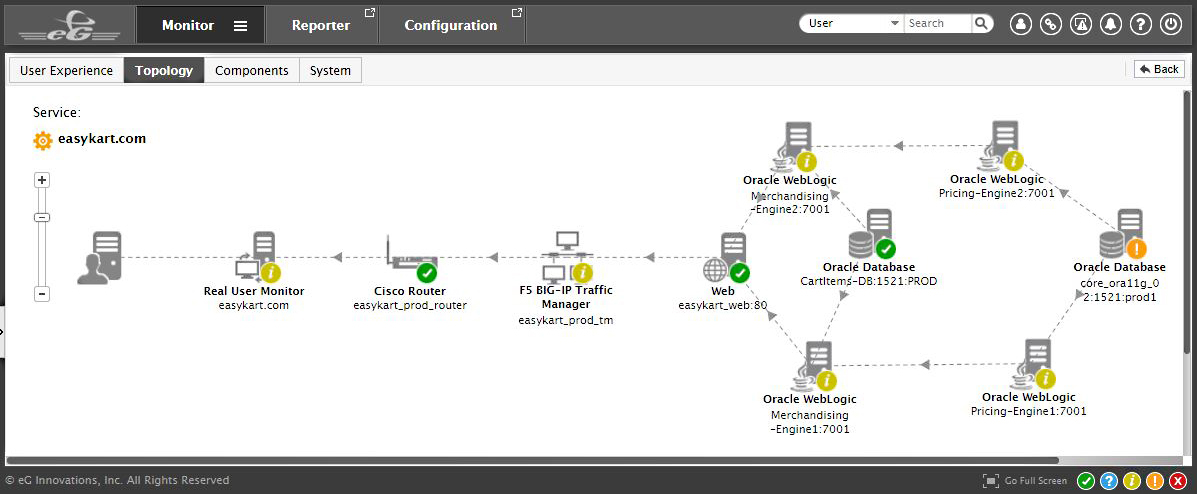
End-to-end service topology view in eG Enterprise.
Here we see that the Oracle WebLogic servers executing the application code are reporting a problem. This is indicated by the Minor Alerts (in yellow) displayed on WebLogic servers on the topology map.
Clicking on one of the WebLogic servers, we can get more details on the server-side processing, which is what RUM indicated as the possible cause of slow page load time.
To provide code-level insights of transactions processed by the Oracle WebLogic tier, eG Enterprise uses a technique called distributed transaction tracing. Application transactions are traced in real-time all the way from the front end, across the application middleware, to the backend database and remote services (if any). The time taken to process the transaction at each stage is measured as shown in the next screenshot below. This helps diagnose which component of the application delivery chain is causing slowness: Is it a faulty code in the application server? Is it a slow query executed by the database? Are any third-party calls taking more processing time? In this case, it's clearly an issue due to slow database query execution (see the screenshot below).
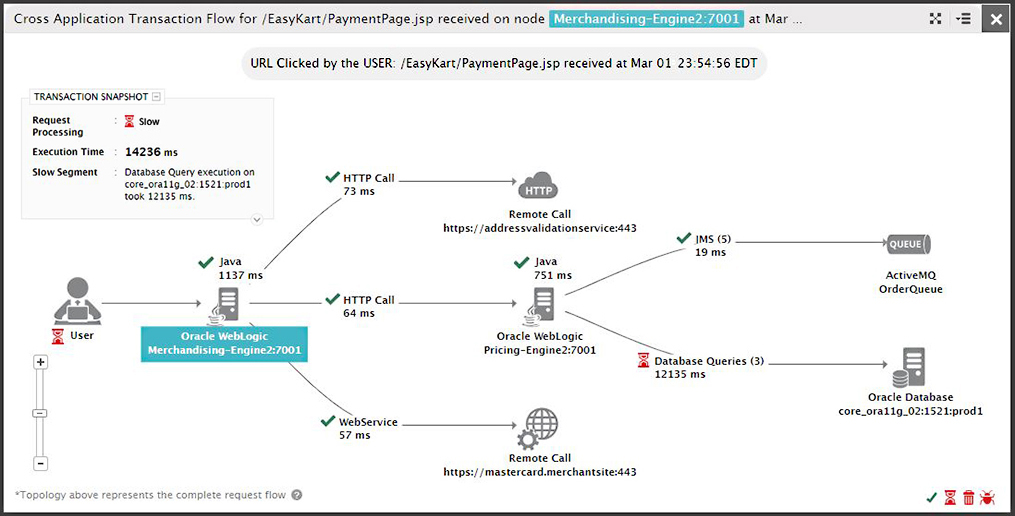
Distributed transaction tracing using eG Enterprise.
Coming back to the service topology map (shown earlier), we can see that there is a Major Alert (in orange) displayed on the backend Oracle database. Clearly, this not an issue with one query alone, but a potential problem with the backend database itself. eG Enterprise has automatically correlated alerts based on the dependencies depicted in the topology map. In this case, eG Enterprise has identified that the problem in the Oracle database server is of higher priority and is causing the slow query problems affecting transaction processing on the WebLogic servers.
Before I move on, I want to quickly mention that while the user experience view using Real User Monitoring (RUM) that I showed you a moment ago is agentless, getting the type of topology view that is shown in the screenshot above requires the use of agents.
By drilling down a bit further, it quickly becomes apparent that the Oracle database's problems stem from a problem with the underlying VMware hypervisor, as shown in the screenshot below. eG Enterprise uses application-to-server/VM and VM-to-host mapping to understand how an issue in the underlying hypervisor is affecting the database running on it. The importance of the fact that eG Enterprise was able to trace the problem to the hypervisor cannot be understated. If this were a real-world situation, then having this information could save the IT staff from wasting time troubleshooting a database server that isn't the true source of the problem. eG Enterprise monitors every layer and every tier of an organization's applications and the supporting infrastructure and employs automatic performance correlation to isolate the root cause of the problem.
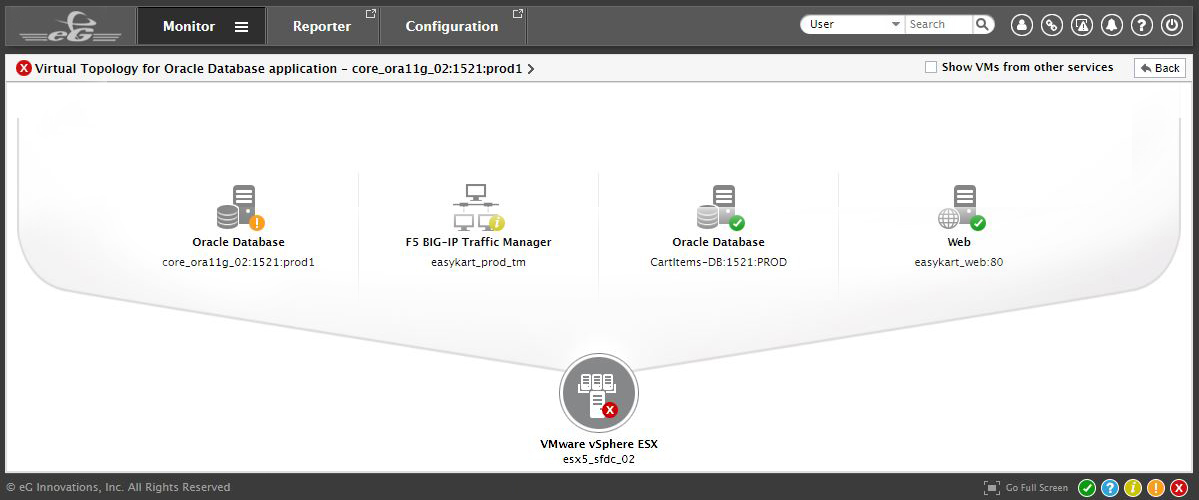
Automatic application-to-virtualization dependency mapping.
In this case, VMware is actually the source of the problem.
If I go just a little bit further, I can see that the problem is caused by the fact that one of the VMware datastores is almost out of disk space, as shown in the screenshot below.
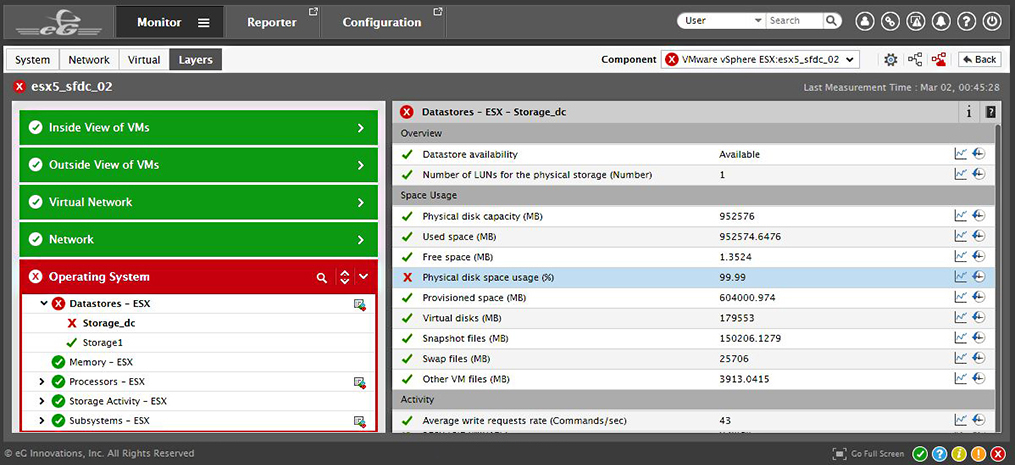
Drill-down into the VMware ESXi host for deeper diagnostics.
The software points to the condition within VMware that is causing the problem.
So, in this case, a user was experiencing poor performance with an application, and eG Enterprise was able to quickly trace the problem to a VMware datastore containing a virtualized database server used by the application. The application was performing poorly, because VMware was running out of storage space.
It is worth noting that because I wanted to demonstrate the software's capabilities, I showed you the long way of doing things. In real life, things are actually a little bit easier. The software maintains a list of alarms for conditions that it considers to be problematic, and there is a good chance that you will be able to diagnose a problem simply by looking at the list of alarms and their priorities, as shown below. Incidentally, the software is capable of sending alerts by e-mail or SMS text message.
The list of alarms in the screenshot below shows that the most critical problem (highlighted by the red alert) relates to the VMware hypervisor.
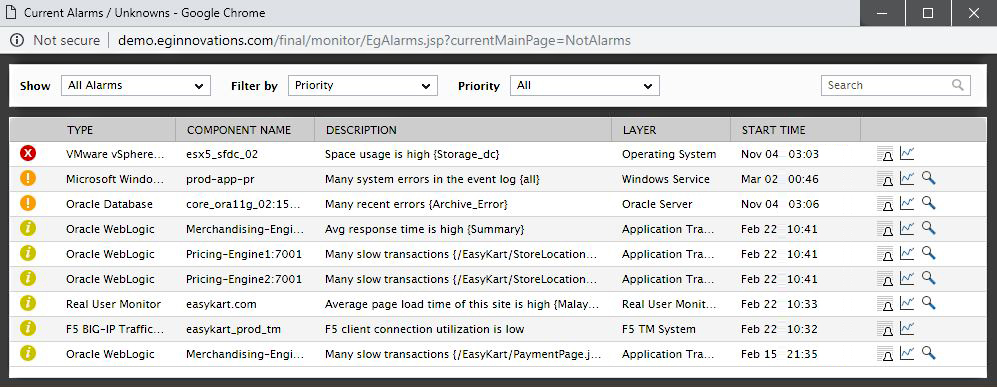
Alarms console in eG Enterprise differentiating the root cause of a problem from its effects.
As you would probably expect, eG Enterprise comes with a really nice monitoring dashboard that is 100 percent web-based and is fully customizable. See the screenshot below. Each person who uses the software can have their own, personal, web-accessible dashboard. There is also a mobile app that provides a similar experience. You can see the monitoring dashboard below.
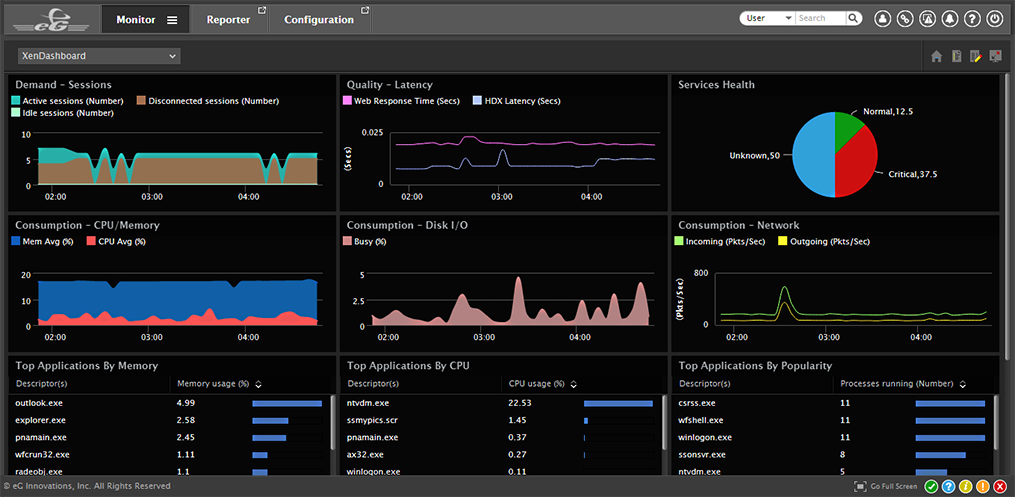
Customizable real-time monitoring dashboards in eG Enterprise.
Licensing
There are two things about the way that eG Innovations licenses eG Enterprise that I really like. First, I absolutely love that the company gives you a variety of different licensing options. With so many companies adopting cloud only or subscription-only licenses, it is really nice to see a company that lets customers license their product according to their own needs. eG Innovations offers a free edition (which is intended primarily for evaluation purposes), an on-premises perpetual license, a subscription-based on- premises license, a cloud-based SaaS subscription, and even an auditing service that can be used on-premises or in the cloud.
The other thing that I like is that unlike most of the enterprise software vendors that I deal with, eG Innovations does not hide their pricing. Although the company does require you to request a quote (as opposed to being able to purchase a license through its website), they at least give you an idea of what the software costs. The minimum cost for a perpetual license is $10,000 and the minimum subscription price is $300 per month.
The Verdict
 Whenever I write a review for this site, I like to wrap things up by giving the product a star rating, ranging from zero to five stars. With that said, I decided to give eG Enterprise a rating of 4.8 stars. That's a gold star rating.
I think that eG Innovations has done a fantastic job with creating eG Enterprise. I absolutely love the software has such deep knowledge of both applications and infrastructure components and is able to correlate that knowledge in a way that allows for root cause diagnosis. On top of that, the software is also able to use its analytic capabilities to provide right-sizing and optimization recommendations and can also help with capacity planning. As you would probably expect, eG Enterprise also features a very rich reporting engine.
My only complaint about eG Enterprise (and I'm being nitpicky) is that the software could conceivably go even further with its troubleshooting capabilities. It would be great to see a few lines of prescriptive text telling you how to fix whatever problem has been detected. Depending on the nature of the problem, it might even be possible to introduce one click remediation. Maybe those capabilities are something for the next version. In any case, I think that eG Enterprise really is a great tool.