Monitor Citrix Virtual Apps and Desktops with real-time analytics, root-cause diagnosis, user experience monitoring, and proactive performance insights.
Free TrialTrusted by leading companies


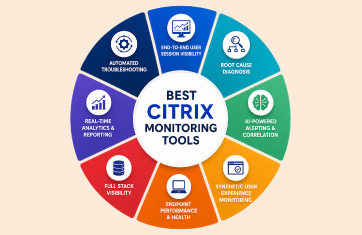
Supports the latest version of Citrix Workspace components. Explore Citrix monitoring solutions for:

Optimize your virtual workspace with Citrix Monitoring to provide real-time insights and enhanced performance management for your Citrix environment.

eG Enterprise goes well beyond what Citrix Director offers, providing visibility into the entire Citrix service delivery chain. You can:
Learn more about Virtual Apps, Virtual Desktops
eG Enterprise delivers best-of-breed performance monitoring for Citrix Virtual Apps and Desktops 7.x environments. Get the best Citrix monitoring software at a very affordable price – monthly charge per user is less than the price of a cup of coffee.

Because we use eG Innovations as a proactive monitoring tool, we can pinpoint latency right away, before users even feel it. They go about their business day to day, without worrying about IT problems.![]()

Proactively find and fix issues before end users are affected with Citrix end user experience monitoring service. Leverage eG Enterprise for Citrix server performance monitoring and gain detailed analytics and real-time insights to ensure reliability of your Citrix server environment.


Virtual Apps | Virtual Desktops | XenMobile | ADC (NetScaler) | StoreFront | PVS | Citrix Cloud | SCOM Management Pack
eG Enterprise is  certified for all products in the Citrix stack
Citrix monitoring is the process of tracking the health, performance, and user experience of a Citrix environment. It involves collecting metrics on sessions, virtual desktops, applications, servers, and infrastructure components to identify issues such as slow logons, latency, or resource bottlenecks.
The focus of many Citrix administrators is often on monitoring resources. However, over the years, it has become clear that what Citrix administrators need to focus on is user experience. Monitoring of Citrix services needs to be set up to support both synthetic and real-user monitoring and should cover all the key user experience metrics, including Citrix logon time, application launch time, screen refresh latency, and so on.
Citrix performance monitoring works by collecting metrics from sessions, applications, VDAs, servers, and infrastructure to track system health and user experience.
Traditional Citrix monitoring often focuses heavily on Citrix-specific components. In larger environments, organizations frequently extend monitoring with broader observability platforms to correlate Citrix performance with networks, cloud services, storage, and application dependencies for faster diagnosis.
While Citrix Director focuses mainly on basic Citrix session monitoring and troubleshooting within Citrix environments, eG Enterprise delivers end-to-end observability across the entire application delivery stack. Director helps administrators identify session-level issues, but eG Enterprise correlates performance across Citrix, infrastructure, networks, applications, cloud services, and user experience monitoring.
Citrix Director is mainly a Citrix helpdesk tool, not a multi-tenant MSP solution or an enterprise class integrated solution: While it allows administrators to connect to a user session and shadow it and troubleshoot problems, Citrix Director does not have granular access control rights needed by any large enterprise/service provider. Since it does not have multi-tenancy built-in, Citrix Director cannot be used by Citrix service providers and MSPs to monitor multiple client deployments from one console. It also does not have wide or deep integration with ITSM tools - another need for MSPs and large enterprises.
Yes, eG Enterprise works for Citrix Cloud as well as Citrix on-premises deployments - or a hybrid of both! Moving to Citrix Cloud doesn't solve every performance problem for end-users and you still need to manage multiple components yourself which Citrix Director doesn't cover.
Citrix monitoring improves user experience by identifying performance issues that affect session speed, application responsiveness, and login times before they become widespread problems. It tracks metrics like latency, resource usage, and connection stability to help IT teams quickly detect and resolve bottlenecks. By providing visibility into both user sessions and underlying infrastructure, monitoring ensures faster troubleshooting, reduced downtime, and more consistent performance across virtual desktops and applications.
Purpose-built platforms for monitoring Citrix such as eG Enterprise offer extensive synthetic monitoring capabilities that allow administrators to proactively test the end-to-end user experience of Citrix deployments even when there are no real users logged in. This allows the proactive detection and remediation of issues before real users are impacted.
Common Citrix performance issues include slow logon times, high session latency, poor application responsiveness, resource bottlenecks (CPU, memory, or storage), profile loading delays, network congestion, and disconnected or unstable user sessions. Organizations may also experience overloaded servers, VDA performance problems, and backend infrastructure issues that affect the end-user experience. These problems can reduce productivity and are often difficult to diagnose without end-to-end visibility across the environment.