This blog has been written in partnership with Citrix Ready Marketing and is also available on the Citrix Website.
Introduction
 As more enterprises deploy their business-critical apps and desktops on the cloud and/or hybrid infrastructure today, Citrix has become their primary choice. Citrix DaaS and VDI solutions are empowering our enterprises to deploy their workloads at any scale by providing great experience and simplified management.
It is also critical to monitor, analyze, and implement proactive measurements to enhance productivity and the user experience through day-to-day issues. Whether addressing performance latency, security enhancements, or adapting to changing work patterns, strategic optimization can significantly improve Citrix Cloud’s overall efficiency.
Therefore, focusing on key metrics and optimizing those to suit your business goals is highly imperative.
In this blog, we will learn about key metrics that will help businesses reach new levels of responsiveness and resilience within the Citrix Cloud digital workspaces.
The Elephant in the Room: Network Metrics
Everybody knows that without the network, there would be no internet connectivity and Citrix DaaS/ VDI would not function. As admins, we rely on a stable network to keep services running to end users. Some Citrix admins are even fully responsible for the network as well! As a former Citrix administrator for a large hospital, I understand that we wear many hats and help our teams in many different areas of infrastructure.
The ability to monitor the network is a must-have when managing hybrid cloud systems like Citrix Cloud. I highly recommend continuous monitoring of the connectivity between the datacenter and Citrix Cloud; this way admins immediately know when their users are affected by an outage.
There are a couple of different network response time metrics based around connectivity. First, response time between each Cloud Connector and Citrix Cloud Portal website https://citrix.cloud.com. Response time is the time taken by Citrix Cloud to respond to user requests. I recommend continuously monitoring to see that this response time is less than one second.
Another key metric that will help to proactively detect potential problems is the network latency of the Cloud Portal. How long does it take over the network to reach the Cloud Brokering Service? What about the Cloud Gateway? Communication bottlenecks are one of the common reasons for poor connectivity, slowdowns, and data loss for a DaaS environment. High latencies from the Citrix tiers can cause failures in the delivery of apps and desktops, thus impacting user experience and productivity. Administrators should always be able to see the user’s round trip time (more details here), which may vary depending on their geographical location.
With the bare minimum of these metrics on your network, you’ll be able to answer the question of – is this a problem with my network or the Citrix Cloud Portal?
Key Metrics for Service Availability
Did you know that when you install the Cloud Connector, it includes 17 services in the installation? The main one being the Citrix Cloud Agent System service. That’s a lot of services to keep track of. Depending on your needs, Cloud Connectors require most services to be up and running 24/7 to accomplish the tedious job of connecting and brokering users. Admins should be aware of both the function and performance of the critical services. For example, if the Citrix Remote Broker Service stops running or uses all of CPU/memory on a server, then this can crush the performance of the server, therefore degrading the user experience.
By monitoring the ‘function’ of a service, you will know if the service up or down. Continuous monitoring shows the time the service stopped and started. Rather than ‘doing a manual check’, which simply tells you if it’s running- having a tool to store metrics at regular intervals is ideal.
Some key performance metrics for each service are CPU usage, memory usage, I/O rate, and Handle count by each service.
Logons are Complicated
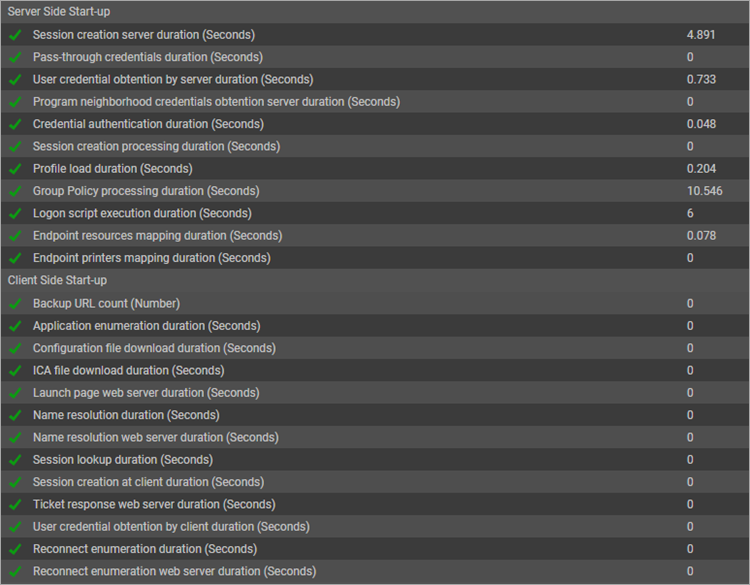
When a user complains of delays in accessing their virtual desktop, the following metrics will help guide the admin to the ‘lowest hanging fruit’ for optimizing logon times:
- GPO processing duration
- Profile load time
- Logon script time
I’ve found that by using eG Enterprise, I can narrow down quickly where to start improving these logon activities. In my previous life as a Citrix administrator, eG Enterprise showed me that the Logon script was taking the longest time and after making some changes according to best practices, logon times were cut in half! (reference: https://www.eginnovations.com/case-studies/st-charles)
In addition to the three metrics above, eG Enterprise breaks down the logon performance to include those ‘black box’ metrics like brokering and authentication duration, as well as the Userinit and Shell phases of the logon. If any of these are the culprits, then take the data to Citrix support for their expertise.
Synthetic Metrics
Sometimes real user data just isn’t enough to be proactive with Citrix issues.
Simulating user logons can provide the admin with a wealth of information before the users start calling in and saying they can’t connect via Citrix.
A perfect example of when to use a logon simulator is like so: you perform an update on the desktop image on a Friday eve, run through a couple of tests and it all appears to be working fine. On Monday nobody can login. It’s a nightmarish situation that can easily be avoided. Also, who makes changes on Friday evenings?
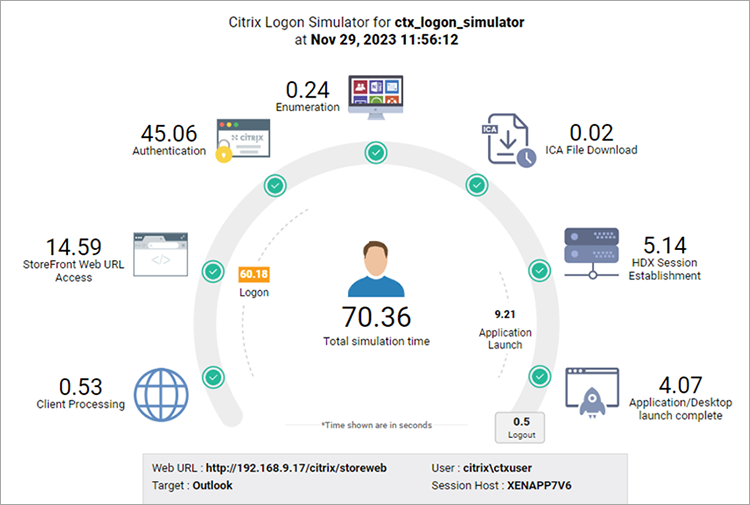
A quality simulator follows the path of the user to launch an app or desktop and collects the following metrics at regular intervals:
- Web store login time
- Authentication duration
- Enumeration time
- App or Desktop launch times
Like Service Availability, the simulator should be able to monitor both function and performance – is it working and how well is it working? Also, the administrator should get notified of failures and slow performance to avoid the nightmare described above.
eG Enterprise Added Benefit
All the metrics above are included in the eG Enterprise monitoring solution. As soon as you add in the Cloud Connectors and the Cloud Site details to eG Enterprise, data comes in at regular intervals. Built-in automatic thresholds will alert admins to anomalies, outages, or performance degradations.
To save the admin from unnecessary wake-up calls in the middle of the night, eG Enterprise also has the ability to automatically restart services on the Cloud Connectors that have stopped running.
eG Enterprise logon simulator for Citrix is available today for free at: https://www.eginnovations.com/citrix-free-logon-simulator.
To learn more about the Citrix and eG Innovations partnership and product compatibility, please contact eG Innovations today to schedule a demo.
eG Enterprise is an Observability solution for Modern IT. Monitor digital workspaces,
web applications, SaaS services, cloud and containers from a single pane of glass.