English
 Deutsch
 Espanol
 Français
 Portuguese
 中文
中文 한국어
한국어 日本語
日本語
RabbitMQ
What is RabbitMQ and How Does It Work?
RabbitMQ is an open-source message broker that enables asynchronous communication between distributed applications and microservices. It supports reliable message delivery using protocols such as AMQP and MQTT, making it a popular choice for event-driven architectures, microservices, and enterprise messaging systems.
RabbitMQ gives separate applications, devices, and platforms a common place to send or receive messages safely. RabbitMQ is well-suited to microservice architectures where some parts of an application publish messages (producers), others consume them (consumers), and RabbitMQ routes the messages between producers and consumers. If no service or consumers can handle a given message, RabbitMQ keeps the message in a queue until it can be delivered.
How does RabbitMQ work?
A RabbitMQ broker is a logical grouping of one or several Erlang nodes with each node running the RabbitMQ application. Each node is a standalone server or process that runs RabbitMQ software and can handle messaging tasks. RabbitMQ nodes can work together to form a RabbitMQ cluster, which provides benefits like high availability, scalability, and load balancing. A RabbitMQ cluster is a logical grouping of one or several nodes, each sharing users, virtual hosts, queues, exchanges, bindings, runtime parameters and other distributed states.
Here's how RabbitMQ works:
Producers and Consumers:
Messages:
Exchanges:
Message Queues:
Bindings:
Routing Keys:
Message Delivery:
Acknowledgment:
Message Persistence:
Publish/Subscribe:
Clustering and High Availability:
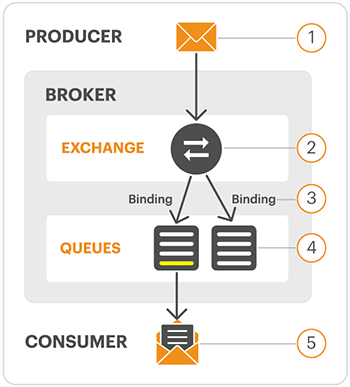
Note: that between the producer and the consumer a message will pass through two intermediate abstractions, first an exchange and then a queue. This abstraction allows for the logical routing of messages. There can be multiple exchanges per queue, multiple queues per exchange, or a one-to-one mapping between queues and exchanges.
RabbitMQ is widely used in microservices architectures, where independent services communicate asynchronously through message queues. As these environments grow, organizations rely on microservices monitoring tools and application monitoring tools to monitor message flow, queue health, consumer performance, and overall application reliability.
How RabbitMQ works – An eCommerce example
Let us consider a real use case for RabbitMQ, an e-commerce system to manage order processing and inventory management. Here is how RabbitMQ can be applied in this scenario:
Use Case: Order Processing and Inventory Management in E-commerce
Components:
The Workflow:
Advantages of RabbitMQ in this Use Case:
Overall, RabbitMQ can play a vital role in ensuring efficient and reliable order processing and inventory management in an e-commerce system while enhancing the customer experience.
What programming languages is RabbitMQ used with?
RabbitMQ provides client libraries for various programming languages, making it accessible to developers using languages and frameworks such as: Java, Python, JavaScript (Node.js), Ruby, .NET (C#), PHP, Go, Erlang (RabbitMQ itself is implemented in Erlang) and more. See: Clients Libraries and Developer Tools — RabbitMQ for a full list.
RabbitMQ Monitoring and Application Performance Monitoring
The RabbitMQ management plugin provides an HTTP-based API for management and monitoring of RabbitMQ nodes and clusters, along with a browser-based UI and a command line tool, rabbitmqadmin.
The metrics and data exposed by RabbitMQ are very good and are also exposed to external monitoring tools. Because RabbitMQ is only a small part of an application’s functionality and because the application’s performance also depends on the application server and its supporting infrastructure most developers rely on a third-party APM tool to monitor and troubleshoot RabbitMQ issues. Popular APM (Application Performance Monitoring) tools which support RabbitMQ, include: AppDynamics, Dynatrace, eG Enterprise, Datadog, New Relic and SolarWinds. Learn more about RabbitMQ monitoring with eG Enterprise here.
eG Enterprise is one of a handful of observability solutions that allow you to trace asynchronous calls across message queues and event-driven systems.
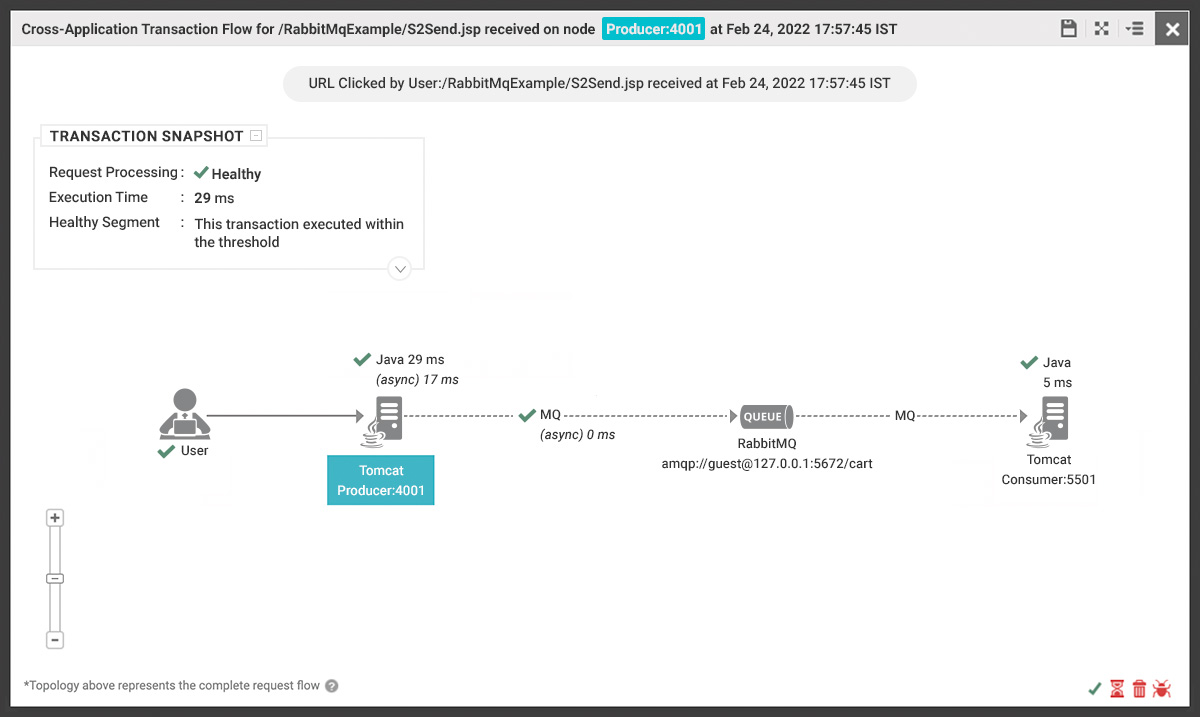
For issues that stem from underlying infrastructure, eG Enterprise will give you "related infrastructure alerts" and visibility for messaging systems such as RabbitMQ. This allows you to triage between code-related and infra-related problems so you can engage the right stakeholder. For example, if there's a disk overflow or any other critical infrastructure issue with RabbitMQ, eG Enterprise will intelligently correlate it with the impacted consumers as shown in APM topology. You will be able to quickly identify why consumers are not receiving messages and take immediate action to resolve the underlying infra problem.
Frequently Asked Questions (FAQs)
RabbitMQ is a message broker that sits between producers and consumers, storing messages in queues until they are processed.
Producers publish messages to an exchange, the exchange routes them to queues based on routing rules and bindings, and consumers subscribe to the queues and process the messages.
In a cluster, RabbitMQ can distribute these components across multiple nodes, with queues tied to a specific node unless they are mirrored.
RabbitMQ monitoring is important because problems in queues, nodes, or message flow can quickly affect application availability and performance.
eG Enterprise’s RabbitMQ cluster monitoring model is designed to detect and alert on issues in availability, status, and performance across both the cluster and individual nodes.
That matters because slow queues, unacknowledged messages, or overloaded nodes can create bottlenecks before users notice a failure.
A good RabbitMQ monitoring solution should give visibility into the cluster, nodes, exchanges, queues, virtual hosts, connections, and channels.
It should also surface useful health and performance questions such as whether nodes are running, whether memory or disk use is abnormal, whether queues are too long, and whether messages are being redelivered or returned.
eG Enterprise’s message-queue monitoring also emphasizes real-time visibility into message processing times, queue sizes, and throughput so teams can identify bottlenecks quickly.
APM helps by connecting RabbitMQ behavior to the application services that depend on it, so teams can see whether a slowdown is caused by the broker or by downstream code.
In eG Enterprise’s setup, RabbitMQ can be monitored through agents or by using the management interface and HTTP-based API to pull metrics from the cluster.
That gives APM-style context around message load, consumer behavior, and queue health, which makes root-cause analysis faster.