
Reprocessing customer files takes a lot of time, and in many instances eG Enterprise has saved us and our clients the pain of this experience by proactively alerting us to performance issues.![]()
Key Benefits to Logic Springs
- Ability to consistently meet application service level objectives
- Reduced alert fatigue; ability to alert on log file exceptions, pre-correlated alarms and actionable notifications
- Total performance visibility and rapid addition of monitoring for new components
- Ability to tune performance and proactively monitor application performance
Why eG Enterprise?
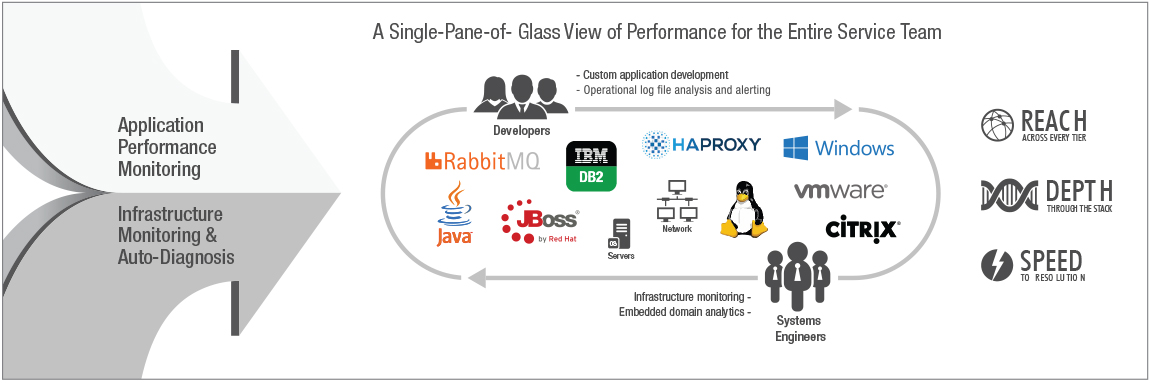
- Complete visibility into custom applications and supporting ecosystems
- Single pane of glass for all stakeholders
- Easy to add new functionality cost effectively
- Embedded analytics provides maintenance-free, automated diagnosis
- Proactive alerting, improved ability to meet customer service level agreements
Logic Springs: Company Background

Logic Springs Technologies provides rail industry solutions emphasizing innovative technology and quality customer service working as partners with their clients, which include 3 out of the 4 largest railroads in the United States.
The custom applications that they develop and manage include coordination of multiple manufacturer OEM parts and panels that must be easily accessed through a central console via a role-specific laptop used by locomotive maintenance staff.
The state of the art software configuration management solution allows their customers to maintain their locomotive fleet, regardless of what components are installed, while providing the maintenance group or outside maintenance service organization with the ability to perform software configuration regardless of shift or location.
This allows for the reprogramming of equipment with OEM applications while having the assurance that no steps will accidentally be skipped and that the correct files will be uploaded. This minimizes the impact of delivery of service for that locomotive in a fashion that allows for easy reference for what was done, when it was done, when it needs to be done again, and who did it along with other pertinent information.
The Challenge: Complex, Diverse Applications and Ecosystems
As a specialized Application Service Provider (ASP), it's essential that the applications perform according to agreed service levels.
Application developers were working with an increasing number of log files and needed to be alerted when certain patterns were identified. At the same time, the Systems Engineering Support Team needed to be able to make sure that all components were operating correctly in real time.
As the diversity of application ecosystems for highly specific customer requirements grew to include Windows and Linux operating systems, VMware ESX and Citrix XenApp virtualization platforms, DB2 databases, JBoss application servers, along with typical networking components – such as switches, routers and firewalls – addressing the needs of the developers and meeting service levels became a real challenge.
The Solution: Log Monitoring for Application Services
Initially, Logic Springs asked eG Innovations to provide a solution for the developers' log monitoring requirements; simply looking into log files and alerting when certain patterns were identified. eG Innovations quickly addressed this initial requirement.
As they began to deploy the monitor for other pplication ecosystem components – such as ESX, XenApp, DB2, Windows/Linux and networking devices – there were a couple new components Logic Springs needed that were missing. RabbitMQ and HAProxy had recently been added, and a request was made to add these to the monitor.
The requirements for these components were specified, new models were built/tested and delivered to Logic Springs in about 3-4 weeks.
eG Innovations has been really easy to work with and helped us quickly implement our monitoring requirements.
![]()

Unifying Performance Visibility Keeps Critical Applications On-Track
Logic Springs can now quickly drill down into any component to get detailed performance information associated with the applications and the supporting ecosystems, including Log Servers, JBoss, RabbitMQ, HAProxy, VMware ESX, Citrix XenApp, DB2 servers, and more. This allowed both the developers and the systems engineering support staff to use the same single pane of glass to get real time performance data.
Today, application developers can get text messages immediately when specific tests fail, and the system engineering staff get real time alerts when performance is outside the norm. This is helping Logic Springs meet service levels and saving both them and their customers time and money.
The developers were pleased that the embedded analytics in eG Enterprise allowed them to limit alerts to specific exception conditions, which reduced 'alert fatigue'. The systems engineers liked the fact that now they are alerted to issues that in the past, they never would have even seen. "The monitor is really well thought-out; its ability to distribute data collection is very efficient and the embedded analytics makes it a great troubleshooting tool," said Mario Camchong, Senior Systems Engineer, Logic Springs.
Logic Springs plans to begin leveraging more of the out-ofthe-box reports and dashboards provided by eG Enterprise in the future, as well as provide staff with eG's Mobile Application for use on the road.