Nutanix is a company focused on delivering hyper-converged infrastructure solutions and cloud technologies. Founded in 2009, Nutanix focuses on simplifying data center operations and enabling organizations build, deploy and manage large-scale virtualized infrastructures easily.
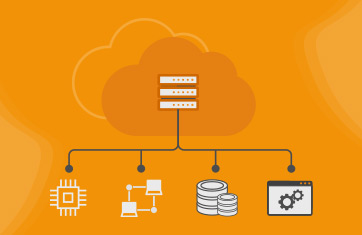
Nutanix Hyperconverged infrastructure (HCI) is Nutanix’s primary product. Nutanix HCI combines computing, storage and networking resources into a single, integrated system. Customers do not need to purchase computing, storage and networking separately. They get a tightly integrated system from one vendor – Nutanix – that can be managed from a single pane of glass. This also allows for more efficient resource utilization and hence, Nutanix HCI is an attractive alternative to other traditional data center infrastructures.
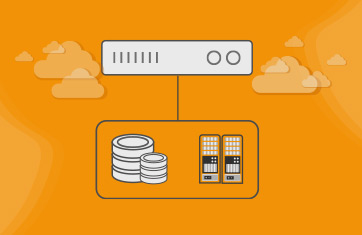
Nutanix HCI works in a distributed architecture. Multiple Nutanix servers work together as a cluster to provide a scalable and highly available infrastructure. Software-defined technologies are used to abstract and manage resources, making it easier to deploy and manage virtualized resources.
Nutanix Cloud Infrastructure (NCI) is a complete software stack to unify your hybrid cloud infrastructure including compute, storage and network, hypervisors, and containers, in public or enterprise clouds; all with built-in resilience, self-healing, disaster recovery capabilities, and security. It includes enterprise data services and consolidated storage, data protection and disaster recovery, native virtualization and container management, networking, and security.
Nutanix AHV delivers enterprise-grade secure virtualization capabilities, such as core virtual machine (VM) operations, VM high availability, live migration, and virtual network management. Nutanix AHV Virtualization focuses on creating, updating, deleting, protecting the data, and monitoring VMs and resources. The cluster services and features are all available through the Prism interface, a distributed management layer.
Nutanix’s offerings are designed to help customers modernize their IT infrastructure, improve agility and reduce operational complexities. Nutanix's solutions allow organizations to move their workloads, including enterprise applications, high-performance databases, end-user computing, VDI services, container-based modern applications, and analytics applications between on-premises and public clouds through unified management, one-click operations, and AI-driven automation.
The flexibility, scalability, and simplicity of Nutanix's hyperconverged infrastructure make it suitable for a wide range of applications and infrastructure modernization initiatives. Common use cases include:
To prevent costly downtime, it's important to use monitoring solutions to manage the health of your Nutanix environment. These monitoring tools provide visibility into your Nutanix environments from clusters and nodes (CPU, memory, RAM, and storage) to host and virtual machines.
Nutanix Prism and Prism Central are the built-in monitoring solutions in the Nutanix stack. They allow administrators to monitor, manage, and optimize their Nutanix infrastructure. Administrators get real-time visibility into the performance, health, and capacity of the entire hyperconverged environment. While Nutanix Prism is the primary management interface for individual Nutanix clusters, Nutanix Prism Central is a centralized management platform that enables the management and monitoring of multiple Nutanix clusters from a single pane of glass.
This depends on the goals of the monitoring project. Nutanix Prism Central does provide an overview of the health and performance of all your Nutanix VM clusters. However, many organizations are not just looking at silo-based monitoring tools - one for Nutanix, another for Citrix/Omnissa Horizon, another for the infrastructure services, yet another for the network and so on.
As organizations look to monitor their IT infrastructures end-to-end, covering every tier of the service delivery chain, they need more than just a tool to look at the VMs and hypervisors. This is where solutions like eG Enterprise come in.
With eG Enterprise, you get comprehensive monitoring of your Nutanix enterprise cloud platform. Through native integration of with Nutanix Prism via REST APIs, eG Enterprise offers visibility into the performance of the Nutanix AHV, the controller VMs on each hypervisor, virtual machine status and resource usage levels, storage disks, and network infrastructure.
At the same time, you can monitor the application stack in-depth. You get insights into the VDI tiers through integration with Citrix and Omnissa Horizon, and you have visibility into web applications, middleware, databases, and more as well, all from a single pane of glass.
To learn more about eG Enterprise, please visit: https://www.eginnovations.com/product