An alert storm in IT monitoring happens when a system suddenly generates a very large number of alerts in a short period of time. Alert storms often occurs because:
Alert storms are a problem and have the following impacts:
Many monitoring products now incorporate AIOps (Artificial Intelligence for IT Operations) engines that leverage dependency models, statistical analysis and machine learning to automatically process data and signals beyond the capabilities of human operators.
Products with AIOps capabilities can eliminate false alerts and alert storms via many techniques including:
Avoiding Alert Storms: Auto-baselining and Dynamic Alert Thresholds
Auto-baselining removes the need to manually tune and tweak metric and alert thresholds. The monitoring system dynamically learns the normal behavior of a system including seasonal or day-by-day / hour-by-hour patterns and adjusts alert thresholds so alerts are raised by anomaly detection. For a comprehensive overview on best practices for metric thresholds and alerting, please see our free whitepaper: White Paper | Make IT Service Monitoring Simple & Proactive with AIOps Powered Intelligent Thresholding & Alerting.
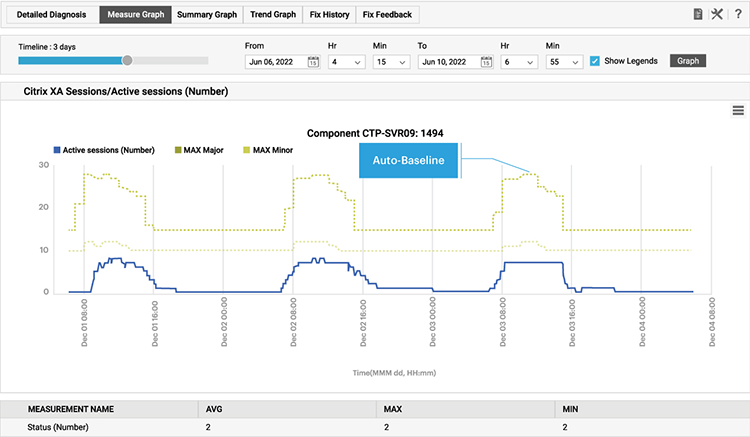
Intelligent dynamic thresholds from auto-baselining help avoid alert storms that arise from using static thresholds alone
To learn more about the limitations of static metric thresholds for alerting, see: Static vs Dynamic Alert Thresholds for Monitoring | eG Innovations.
Avoiding Alert Storms: Alert Correlation
Alert storms often happen when monitoring systems generate a flood of notifications for a single issue, overwhelming teams and obscuring the real root cause. This can reduce efficiency, cause alert fatigue, and delay incident resolution. Alert correlation is a technique used to avoid these storms by grouping, linking, or deduplicating related alerts so that teams see meaningful incidents rather than noise.
Event correlation works by analyzing patterns such as time, topology, and dependencies. For example, if a server goes down, it might trigger dozens of alerts from databases, applications, and services that rely on it. Instead of displaying each alert separately, correlation tools recognize the common source and consolidate them into a single, higher-level alert. This helps responders quickly understand the true scope and impact of the issue without sifting through repetitive messages.
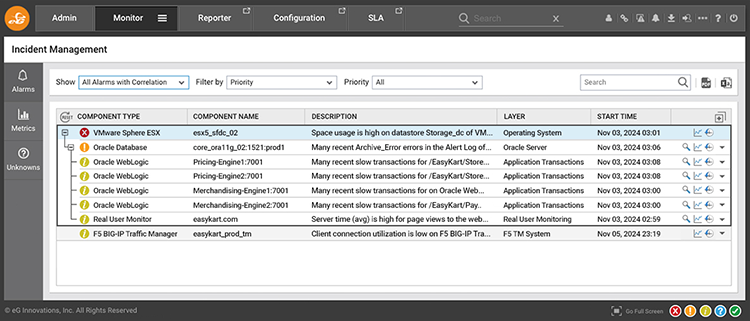
eG Enterprise’s AIOps engine groups and prioritizes alerts to avoid alert storms with secondary effects ranked lower priority than the primary root cause. Here a VMware server failure was identified as the root-cause of many Oracle failures
Advanced correlation can also apply machine learning or rule-based logic to identify recurring patterns, highlight probable root causes, and prioritize alerts based on severity or business impact. By filtering noise and providing context, alert correlation improves incident response times, reduces stress on operations teams, and ensures critical issues are resolved faster. Ultimately, it turns raw monitoring data into actionable intelligence.
Learn more about alert and event correlation, see: What is Event Correlation? And Why Does Event Correlation Matter when Monitoring? | eG Innovations.
Avoiding Alert Storms: Granular Modifiable Alert Priorities
An important feature of enterprise monitoring products is for alerts to be assigned a spectrum of alert priorities, moreover it is important that these priorities can be modified and an alerts priority assigned.
When CPU usage on a server reaches 90% you may wish to trigger a minor alert but when CPU usage reaches 99% you may wish to raise a major alert. Freeware monitoring tools may issue separate alerts when each threshold is breached leaving you with multiple alerts of varying priorities for the same issue. This type of scenario causes alert storms. Enterprise grade monitoring tools will change the priority of the alert clarifying the current severity and minimizing the number of alerts.
Learn more about alert prioritization features, see: Alarm Priorities in IT Monitoring - IT Glossary | eG Innovations.
Avoiding Alert Storms: Aggregated Metric Alerting
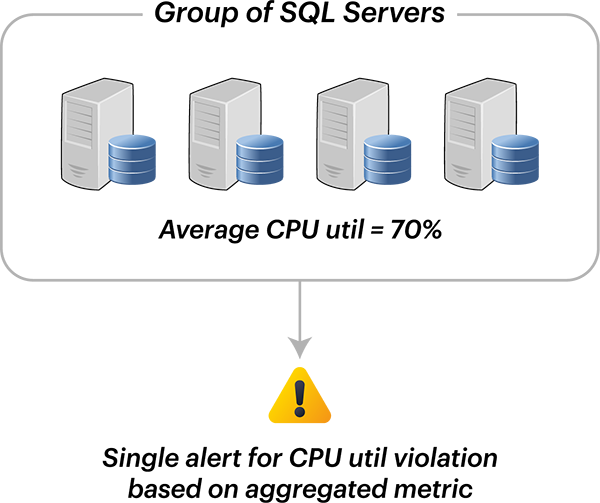
With many modern systems designed at scale and for failover, it is common for modern monitoring systems to allow metric aggregation across multiple components or entities of the same type. Alerts can be configured when the availability across all web servers falls below 60% vs. when a single web server has issues. This can reduce alert storms especially in systems built with load balancing and redundancy in mind.
Metric aggregation allows you to trigger alerts based on aggregated value of a metric for a group of components of the same type to get a farm-level or group-level view of components.
Metric aggregation is a feature available within most cloud native tools such as Azure monitor.
Many basic metric aggregation implementations are limited because the aggregated value is limited to mathematical functions such as average, sum, min and max values. Consider a cluster of 5 SQL Servers where 3 are operating at a CPU usage of 85% but 2 have 0% usage. The average usage would be evaluated as (85*3 / 5) = 51% and if a threshold of 80% was set no alert would be raised.
It is far more likely the administrator would want be to be alerted when, for example - 3 SQL servers out of 5 have CPU usage over 80%.
Basic metric aggregation has a fundamental limitation in that there is no way to compare metrics across servers and alert when a certain number of servers deviated from a target value. This is particularly problematic when systems are deliberately designed with clusters of components designed for failover with automatic recovery systems in place. It is very common for web servers to be clustered to ensure high-availability, “conditional aggregation” addresses the requirements of administrators in such scenarios.
Avoiding Alert Storms: Compound Performance Ratings
Rather than setting alerting based upon a single metric such as either CPU or RAM, performance ratings (similar to Apdex scores) can be used to determine the overall health of component – for example: a stress rating for a server can be based on its CPU utilization, memory utilization, disk space available and disk activity level. This allows a single alert rather than multiple alerts to be raised when the server experiences issues.
In legacy monitoring tools, thresholds are usually set for each metric for example:
However, often it makes more sense to raise a single alert when multiple conditions are met for a specific component, for example:
Enterprise grade monitoring tools will usually incorporate weightings so that the value of certain metrics is prioritized when making a decision as to whether the compound threshold has been exceeded sufficiently to trigger an alert.