Every modern monitoring product will have some capabilities to leverage thresholds of some sort to automatically raise alerts when critical metrics pass a value that indicates something of concern may be occurring, such as a performance slowdown, resource constraint, or availability issue. Enterprise grade products and native cloud monitoring (e.g., Microsoft Azure Monitor used with services such as AVD) will usually include options to use both static and dynamic thresholds and occasionally combine them. This article will explain the differences between these strategies including the benefits of combining static and dynamic thresholds to reduce false positives and alert storms whilst implementing automatic anomaly detection.
Static Thresholds
Static thresholds are fixed values that represent the limits of acceptable performance. For example, a server with more than 95% CPU utilization is likely to have a problem. In general though, threshold configuration requires expertise; whilst server CPU usage is a widely well-understood metric, many admins would struggle to produce a similar number on the spot to act as a threshold for a metric such as “Blob success end-to-end latency (Seconds)” on an Azure storage disk. Beyond the need for significant domain-knowledge to set up thresholds on most metrics, static metrics simply are not suitable for measures that vary with time or with server.
Tuning and manually setting-up static monitoring thresholds is a significant challenge for IT teams and laborious, requiring significant on-going attention for maintenance.
- The need to tune effectively limits the number of thresholds implemented, and often the same thresholds are used across similar components – e.g., every VM or Server, where in practice those servers and VMs (Virtual Machines) – are serving vastly different business applications.
- It will take further manual tuning to override the standard thresholds for applications that have varying loads and behaviors, and without manual tuning a monitoring tool will not report many significant issues or will mis-classify the severity of an issue or in many cases report issues where none exist (false positives).
In a large enterprise, a monitoring tool that provides visibility into the different network, server, and application tiers can collect millions of metrics. Having to set thresholds manually for every single metric is a very time-consuming, monotonous exercise. As a result, enterprises end up spending a lot of time and money having consultants tune thresholds manually and most adopt technologies that include dynamic thresholding capabilities.
Dynamic Thresholds
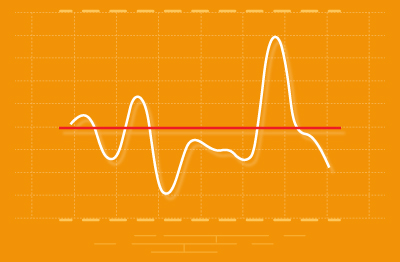
Most enterprise and cloud monitoring solutions acknowledge the limitations of static thresholds by implementing machine learning technology and including an AIOps (Artificial Intelligence for IT Operations) engine capable of learning about the normal behavior of systems over multiple timeframes. This means that normal is understood with the context of time-of-day, day-of-the-week, monthly and seasonal variations.
Once the real usage of a system has been established, this type of auto-baselining learns what is normal and dynamic thresholds can be applied e.g., raise an alert if the bandwidth used by a server exceeds 200% of normal usage.
A dynamic system should learn that a high CPU load during a nightly backup is normal, but that 80% CPU utilization on the same server on a mid-week morning is abnormal. When such tuning is automatic, an IT monitoring strategy can include thousands of thresholds, even ones that change over time to follow business cycles or vary between similar components e.g., web servers serving different applications. Dynamic thresholds are ideal for metrics which are time variant such as number of requests to a web server, the workload on a database server etc.
The benefits of dynamic thresholding leveraging AIOps (Artificial Intelligence for IT Operations) technologies is that millions of data points can be ingested and automatically adjusted to maintain thousands and thousands of metric thresholds providing coverage way beyond what a human IT team could maintain or manage.
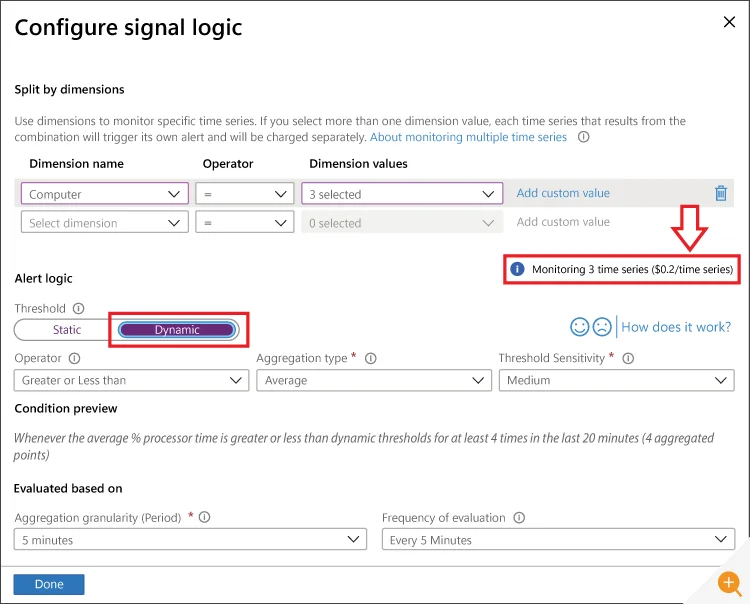
Whilst AIOps based monitoring tools can process millions of datapoints to automatically define large numbers of thresholds automatically, in practice many still require significant manual configuration. For example, within Microsoft Azure Monitor, whilst the actual value of the metric thresholds will be calculated within the product based on past learned behavior the administrator needs to configure each metrics and many associated parameters (see Figure 1), such as alert severity, granularity of sampling (over how long a time period is an anomaly is considered significant) and sensitivity (is a deviation of 20% or 200% from normal considered reportable).
Those looking to configure alerts for AVD and other Microsoft technologies using Azure Monitor may like to read this guide to setting up alerts for Azure Monitor, see: Azure Virtual Desktop Monitoring.
For those wanting to avoid the overhead of configuring dynamic thresholds, solutions such as
eG Enterprise integrate the automatic deployment and setting of key thresholds for every one of its domain-aware components. Once deployed auto-tuning or manual-tuning can be further used to tweak the system to any exceptional needs.
Dynamic thresholds are a key component of anomaly detection and proactive monitoring strategies needed for MSPs (Managed Service Providers) to meet formal criteria within frameworks such as the AWS MSP Partner Program Validation Audit Checklist – to learn more about, please see: What is Proactive Monitoring and Why it is Important.
|
With a system that automates deployment and configuration, IT organizations can implement proactive monitoring by monitoring far more than % of CPU or bandwidth used. There are many IT metrics that can provide early warning indicators of problems and performance degradations long before systems fail or real users encounter problems that impact their work, if caught early actual performance or availability issues can be averted. Such metrics include:
|
Problems with Dynamic Thresholds
Dynamic thresholds though do have some problems, TechTarget editor Alistair Cooke covers these in an excellent article in which he summarizes that – “Dynamic thresholds are not as intelligent as people”. Some of the problems include:
- Dynamic thresholding can become confused when normal cyclic patterns are not adhered to e.g., a public holiday means only a small number of staff logon on a weekday.
- Dynamic monitoring tools deployed in a broken or poorly performing IT environment can learn that state as normal and even start to send alerts due to it getting better.
- Dynamic systems are also inclined to view things that get broken for a while as the new normal. If a storage array slowly gets overloaded and unresponsive, the dynamic threshold monitoring system will register the overloaded state as the new normal.
- Systems deployed in test or pre-production may have little realistic load e.g., VMs are not accessed by real users using applications so dynamic thresholds may benchmark their normal usage as 3% CPU.
Overcoming Dynamic Threshold Issues by Combining Static and Dynamic Thresholds
Automatically determined dynamic thresholds are ideal for metrics that are time variant. Often, the same metric may vary significantly from one server to another and from time to time. Consider a staging environment with a Citrix server. Typically, there is no load on the Citrix server and the automatic threshold is set accordingly. When someone logs in, the threshold will be breached, and an alert may be raised by the system. This is a false alert because one user logging in does not signify a situation of interest to an IT manager. This scenario shows that while automatic thresholding reduces the effort involved in configuring the monitoring tool (because IT managers do not have to configure thresholds for every metric and server), it does not eliminate false alerts.
Therefore, eG Enterprise allows IT managers to use a combination of static and automatic dynamic thresholds. A static threshold applied along with an automatic threshold provides a realistic boundary that must be crossed before an alert is to be triggered. An IT manager can now configure an absolute maximum and an automatic maximum threshold for a metric. eG Enterprise compares the actual measurement value with the higher of the two maximum thresholds and generates an alert only when the higher threshold is violated. In the example of the staging Citrix server, the IT manager can set a static limit of say 10 sessions. Once this is done, only if the actual load exceeds 10 current sessions will an alert be generated, even if the auto- computed threshold is less than 10. If the auto-computed threshold is greater than 10, this value is used as the actual threshold.
Other AIOps Features, Beyond Dynamic Thresholds
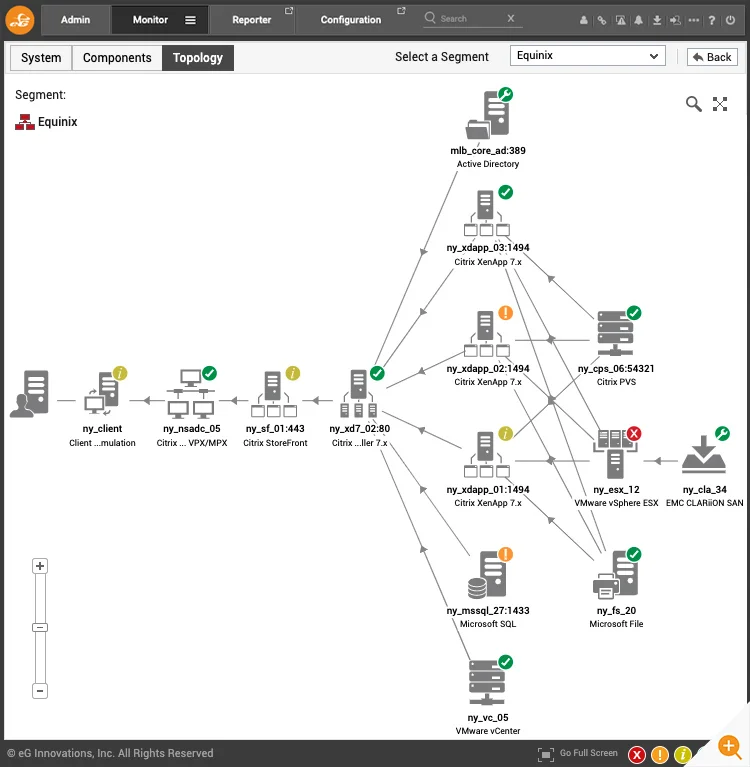
When looking to adopt an AIOps technology that can offer dynamic thresholding, you will also want to review what other AIOps features have been implemented. Some products such as eG Enterprise leverage the AIOps technologies further to reduce false alarms by filtering and correlating alerts to pinpoint the root-cause rather than secondary issues and symptoms. For example, if a VMware vSphere server host fails within eG Enterprise; this will be highlighted as the primary issue rather than the numerous in-VM user experience issues happening because of the host failure those sessions reside upon.
An overview of AIOps features is covered in our articles and a one-stop eBook: AIOps Solutions and Strategies for IT Management.
Understanding Alerts and Thresholds for the Help Desk Operator
Once thresholds have triggered alarms and alerts it is critical that the help desk operator or system administrator has instant access to understand which threshold has triggered the alert and the history of that metric alongside sufficient information for a non-domain expert to evaluate its significance.
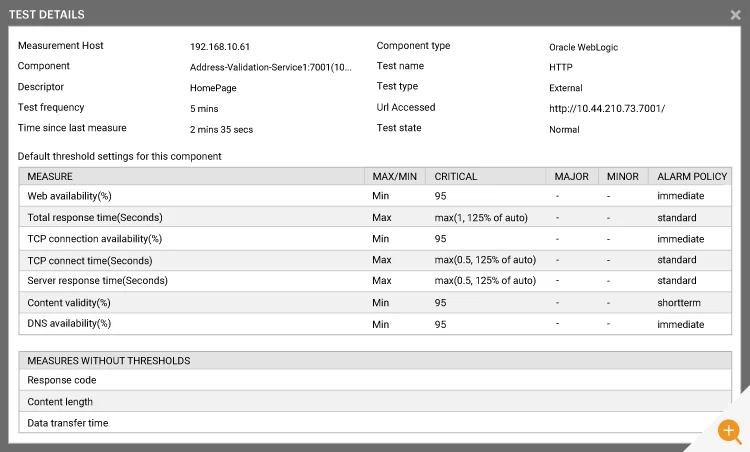
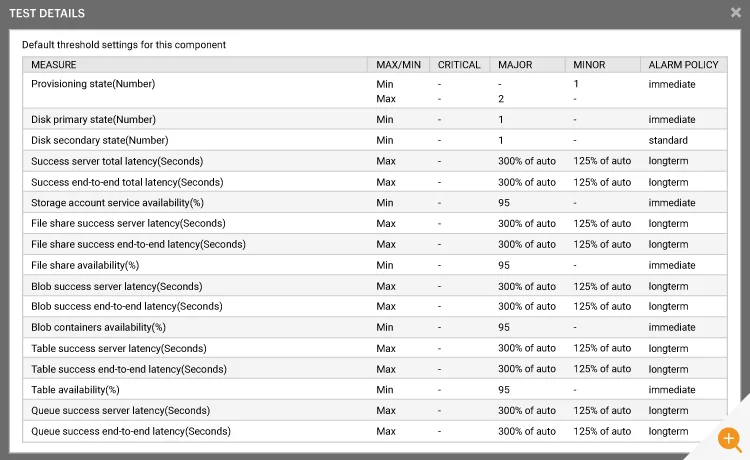
On components such as storage there is usually an enormous range of metrics made available to monitoring products to monitor, out of the box eG Enterprise leverages this to provide proactive threshold monitoring on many lesser-known metrics, however if an alert is triggered all the information on how those thresholds are configured is available out of the box, see Figure 3.
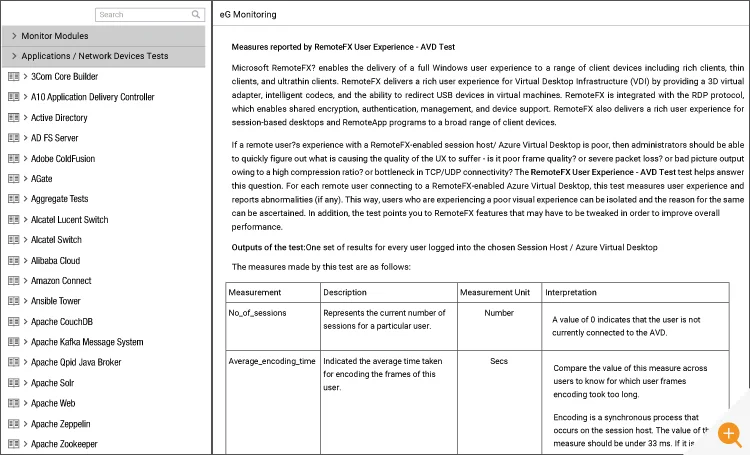
Moreover, the built-in eG Enterprise “Knowledge Base” means the frontline helpdesk operator has instant access to documentation explaining these less-familiar metrics, why the value has been configured to trigger an alert at this level and other information to check or suggestions of fixes without resorting to googling obscure internal metric names or reverting to other consoles for an explanation, see Figure 4 as an example.
Because eG Enterprise has implemented event filtering and correlation, when alerts are triggered, root-cause diagnostics group alerts and provide simple color-coded overlayers and interfaces to guide help desk operators and administrators. Internally, the understanding of topologies and inter-dependencies available to the AIOps engine ensures thresholds and alerts are effectively correlated to allow root-cause diagnosis.
Features to Evaluate When Choosing Monitoring Products
If looking to implement static and dynamic thresholds on metrics, it may be useful to evaluate your needs for other interdependent features and qualities:
eG Enterprise is an Observability solution for Modern IT. Monitor digital workspaces,
web applications, SaaS services, cloud and containers from a single pane of glass.
- Are both static and dynamic thresholds available?
- Can you combine static and dynamic thresholds?
- Are thresholds configured out of the box?
- Are there AIOps capabilities such as root-cause diagnosis and event filtering and correlation?
- Once set up it is it transparent to the operator what the metrics are and why they have been set I.e., can your frontline support understand why alerts are being triggered
- What ITSM service and help desk tool (e.g., ServiceNow, JIRA, Autotask) integrations are available? Once thresholds trigger alerts how do you intend to manage the IT issues they have highlighted?
- Can metrics be aggregated – e.g., an alert triggered if 30% of a cluster of web servers goes down vs. an individual server.
- Can components and their associated alerting thresholds be excluded from triggering alerts temporarily during deployment or for maintenance?
Learn More
- Further details on static and dynamic thresholding strategies is available in a free white paper: White Paper | Make IT Service Monitoring Simple & Proactive with AIOps Powered Intelligent Thresholding & Alerting (eginnovations.com)
- To learn about how to understand, evaluate and leverage AIOps features, see AIOps Solutions and Strategies for IT Management | eG Innovations
- eG Enterprise can be deployed on premises, in a cloud of your choice or via ready-to-go SaaS (Software as a Service), for those looking to explore the benefits of static and dynamic thresholds and combining them a free trial on our SaaS option may be the best choice: How to Deploy eG Enterprise – Choices and Models | eG Innovations
- TechTarget have several articles on the benefits of static vs dynamic alerts, including: Monitoring thresholds determine IT performance alerts (techtarget.com) and How AIOps monitoring eases modern IT challenges (techtarget.com)
- Read about integrating alerts with help and service desk tools such as Slack, ServiceNow, Autotask, JIRA, and others: Service and Help Desk Automation Strategies
- We have a series of short (2-3 min) videos covering the eG Enterprise interface including many aspects of alerting and thresholding, including: How to Review and Interpret Alarms, Understanding and Modifying Thresholds, Understanding and Modifying Alarm Policies, and Creating Group Thresholds



 Rachel has worked as developer, product manager and marketing manager at Cloud, EUC, application and hardware vendors such as Citrix, IBM, NVIDIA and Siemens PLM. Rachel now works on technical content and engineering and partner liaison for eG Enterprise


