


How to Monitor Azure Virtual Desktop (AVD) Technology
One question many administrators are asking is: How can I effectively and efficiently monitor Azure Virtual Desktop technology? There are several options for monitoring Azure Virtual Desktop technology and this blog will cover some of the most popular ones.
In this blog, we will focus on multi-session, native Azure virtual desktops. Since Citrix and Omnissa Horizon have been adopted for several years, monitoring capabilities and best practices for these technologies are well documented in blogs and whitepapers.
Four Big Challenges When Monitoring Azure Virtual Desktop Technology
While AVD technology is simple to provision, it can be quite challenging to monitor Azure Virtual Desktop, and to operate and troubleshoot it. There are many reasons for this:

- IT teams must troubleshoot AVD problems with limited visibility. With on-premises technologies like Citrix and Omnissa Horizon, the IT team had complete control over every layer and every tier of the infrastructure, servers, storage and other technologies supporting the digital workspace service. With AVD, the underlying infrastructure is controlled by Microsoft. The applications being accessed may be under the control of a different service provider.
- The distributed nature of AVD makes monitoring more difficult. AVD deployments are also more distributed than on-premises digital workspaces. The applications being accessed and the virtual desktop that the user is connected to could be in different geo locations. Even for authentication, synchronization between AD Connect in the cloud and an on-premises AD is required.
- The pay-as-you-go model of AVD means that cloud costs increase with usage. Tracking any wasteful resource usage and providing recommendations for optimization also falls under the purview of monitoring technologies for AVD.
- When a problem happens, it is a challenge to determine where the cause of the problem lies. Like other digital workspace technologies, AVD is extremely performance sensitive since users connect to their digital workspaces from remote locations, with limited resources on the client. The problem could be with the user’s network, with the application being accessed, a bottleneck with Azure resources, an Active Directory issue, etc.
What SLAs does Microsoft provide for Azure?

A significant attraction of Microsoft Azure is Microsoft’s commitments via service level agreements (SLAs) to high-availability and uptime with most Azure services guaranteeing availability 99.9% of the time or higher. For AVD itself though Microsoft does not offer a financially backed SLA and the commitment is to “strive to attain at least 99.9% availability for the Azure Virtual Desktop service URLs”. The availability of the session host virtual machines in your subscription is covered by the Virtual Machines SLA.
10 Questions that a Tool for Monitoring Azure Virtual Desktop Technology Must Answer
Before you begin your search for tools to monitor AVD, you must be able to answer these key questions. Knowing the answer to these performance-related questions will mean that you can troubleshoot problems faster, reducing MTTR, spot problems before they impact end-user experience, and empower your helpdesk.
- Like all digital workspace technologies, the success of AVD is measured by user experience. The first question to answer is how is the user experience for desktop users? Is the AVD service available throughout and how long does it take to access a desktop?
- Getting logon to work is like getting a dial-tone on your old landline telephone. A key question is whether AVD logon is working and how long does it take for a user to login? If the logon duration is high, why is it so high?
- Once a user is connected to their virtual desktop, if access is slow, it will affect user productivity. Is there any lag during user access? Are there any packet losses or retransmissions while the session is in progress?
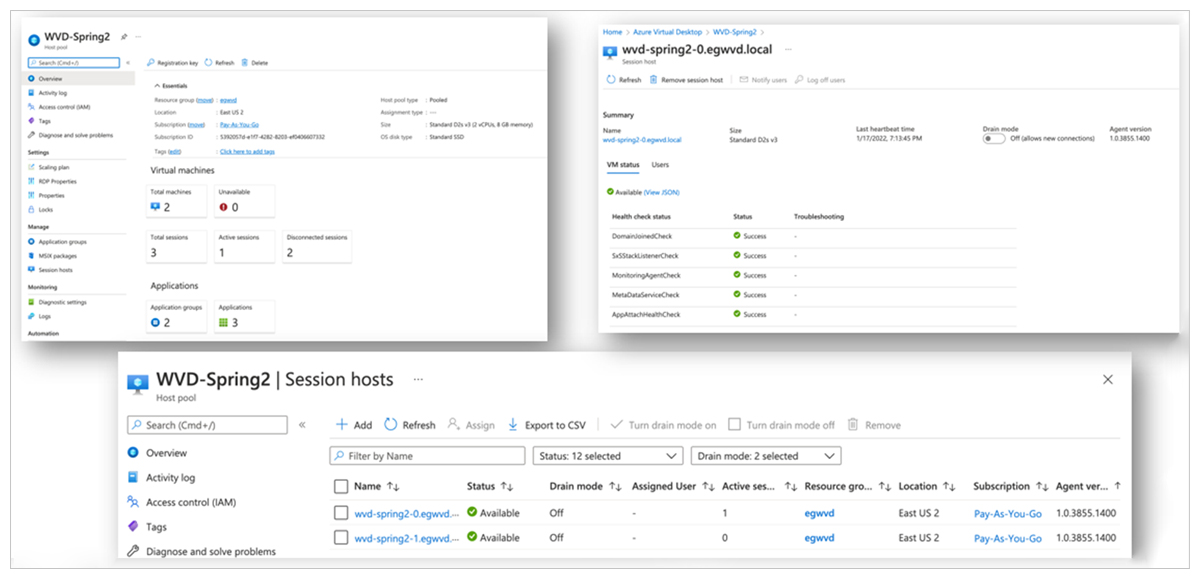
- What is the resource usage level on the session hosts that the users are connected to and is there a bottleneck on the hosts?
- Are there many disconnected sessions (i.e., sessions taking up resources but do not have an active user) on the session hosts?
- Is the workload balanced across all the session hosts?
- Is any session host idle (i.e., there is cost wastage), and is any session host without a heartbeat (i.e., can’t get any new sessions)?
- Are there any connection failures occurring to the AVD service?
- Has any unusual sign-in activity been detected through Azure AD?
- Are there sufficient session hosts to handle the workload, or do you need to provision additional capacity?
These are just some of the many questions that come to mind when tracking the performance of an AVD deployment.

4 Key Capabilities Your Tool for Monitoring Azure Virtual Desktop Technology Must Have

1. Ability to monitor the experience of AVD users
In the AVD adoption survey, respondents told us that the biggest challenge in an AVD deployment is end-user experience. Most monitoring tools can tell you the resource usage of your IT infrastructure (CPU, memory, network, storage, etc.) but don’t translate that into end-user experience.
User experience monitoring can be performed using synthetic transactions – i.e., simulating a user logging in and accessing AVD. It can also be performed by monitoring real users. Ideally, your monitoring solution for AVD must support both synthetic and real user monitoring.
2. Ability to monitor every layer and every AVD tier is important
When user experience is poor, e.g., logon time is 2 mins, the immediate question is: why is the AVD user experience poor?
Answering this question is difficult. Sometimes the issue could be in Active Directory, sometimes it could happen because the storage tier is slow, or it could be because the FSLogix profile management container has not been attached.
Only by monitoring every layer and every tier can you quickly and accurately identify where the root-cause of the performance problem is.
3. Embedded AIOps capabilities that use machine learning
When monitoring an AVD deployment with hundreds of concurrent users, a monitoring tool may collect several thousand metrics. Analyzing these metrics manually is time-consuming and cumbersome. Monitoring tools for AVD must possess the capabilities to analyze thousands of real time metrics at scale.
They must embed AIOps capabilities that use machine learning to analyze metrics and highlight where the abnormalities lie. Ideally, when analyzing the dependencies of an AVD service the monitoring tool should be able to do root-cause analysis and pin-point where the real problems lie. This is so IT admins can focus on them and not be distracted by the symptoms rippling out from that root-cause.
4. Embedded intelligence to detect unusual usage patterns, wasted resources,1 and insufficient provision capacity
Finally, as we discussed earlier, cost is an important roadblock to wide-spread AVD adoption. AVD monitoring tools should have embedded intelligence to detect abnormal usage patterns, wasted resources, insufficient provisioned capacity, etc. They should also provide recommendations, so IT admins can optimize their AVD deployments for maximum performance at minimal cost.
What Tools Can You Use for Monitoring Azure Virtual Desktop Technology
Azure Virtual Desktop adoption is still in the nascent stages, so there are not the variety of tools to monitor AVD as there are monitoring tools for Citrix. There are two main options at the moment:
- Azure Monitor, which is the native cloud monitoring service from Azure
- A third-party tool like eG Enterprise.
Using Azure Monitor for AVD Monitoring

Azure Monitor for Azure Virtual Desktop is a dashboard built on Azure Monitor Workbooks that helps IT professionals understand their Azure Virtual Desktop environments.

Before you start using Azure Monitor for AVD, you’ll need:
- At least one configured Log Analytics Workspace. Use a designated Log Analytics workspace for your Azure Virtual Desktop session hosts to ensure that performance counters and events are only collected from session hosts in your Azure Virtual Desktop deployment.
- Enable data collection for the following things in your Log Analytics workspace:
- Diagnostics from your Azure Virtual Desktop environment
- Recommended performance counters from your Azure Virtual Desktop session hosts
- Recommended Windows Event Logs from your Azure Virtual Desktop session hosts
You’ll also need to provide:
- Read-access to the Azure resource groups that hold your Azure Virtual Desktop resources
- Read-access to the subscription’s resource groups that hold your Azure Virtual Desktop session hosts
- Read access to the Log Analytics workspace or workspaces
To access Azure Monitor for Azure Virtual Desktop, you can Search for and select Azure Virtual Desktop from the Azure portal, then select Insights.
 | Note: Setting up Azure Monitor to monitor multiple subscriptions is not straightforward. You would set up a Log Analytics workspace to monitor resources in all of your subscriptions as long as they are under the same Tenant. If you have multiple Azure AD Tenants, like an MSP would, you will need to use Azure Lighthouse to see all subscriptions under your main tenant. |
The various steps involved in setting up Azure Monitor for AVD are explained here: https://docs.microsoft.com/en-us/azure/virtual-desktop/azure-monitor
Log Analytics and Azure Monitor are additional paid for services that together are often used to implement a basic level of monitoring, reporting and alerting. A Log Analytics workspace is a unique environment for Azure Monitor log data. Each workspace has its own data repository and configuration, and data sources and solutions are configured to store their data in a particular workspace.
With Azure Monitor, you can monitor all key AVD metrics. You can select any of the collected metrics and see charts and graphs over time. Alerting capabilities are also available.
Billing is based on data ingested and also on the storage for any data retained beyond the default 30-day retention period. Alerting is an additional cost billed per alert threshold set, costs vary dependent of alert type used (static vs. Dynamic).
Common Challenges that AVD admins highlight with Azure Monitor
There are many challenges with using Azure Monitor for tracking AVD performance bottlenecks:
- Setting it up involves a lot of manual effort, especially around what metrics to collect, what thresholds to set, when to get alerts, etc.
- Difficult to estimate cost, especially the costs of monitoring as this depends on many factors – number of metrics, types of thresholds, etc.
- Integration with other ITSM tools and enterprise workflows is not straightforward.
- Very often AVD admins have to write Kusto queries to generate reports they need.
- Azure Monitor is more a tool for the AVD admins. It is not simple enough that it can be used by help desk operators.
- Free-form text fields (e.g., for naming alerts) make it hard to enforce standards and conventions and ensure human readable information is available.
- Very often AVD is deployed along with other digital workspace technologies like Citrix and VMware. Azure Monitor cannot be used for monitoring these traditional digital workspace technologies and hence, separate consoles are needed for Citrix and Omnissa Horizon monitoring.
- Azure Monitor has no built-in synthetic monitoring capabilities for AVD.

Using eG Enterprise for Monitoring Azure Virtual Desktop Technology

eG Enterprise is a specialized monitoring solution for digital workspace environments. With over a decade of experience supporting some of the largest digital workspace deployments, eG Enterprise includes out-of-the-box dashboards and reports that typical AVD admins need.
- Minimal configuration required. Just install agents on your session hosts and your host pool and its hosts are auto-discovered and monitored.
- Granular user session tracking. All user sessions are tracked at a granular level and all aspects of user experience are monitored for every session. This includes Windows logon time, breakdown of time spent into GPO processing, FSLogix processing, connection brokering, etc., input delay for the session, round trip latency, packet loss and retransmissions, application launch time, etc.
- Proactively notifies admins of performance problems. Synthetic monitoring is also supported so AVD admins can track performance of the service 24×7 and be proactively notified of any problems with desktop access or slowness.
- End-to-end topological view of the AVD service. Besides monitoring the session hosts, eG Enterprise also monitors the AVD brokering service, Azure AD, Azure Subscription, Azure AD Connect and so on. This way it can provide an end-to-end topological view of the AVD service.
- Over 20 pre-built reports for AVD admins. AIOps capabilities embedded in the solution help with proactive alerting, alarm correlation to pinpoint the cause of problems. Out of the box, the solution has the top 20+ reports that AVD admins need pre-built.
Enabling Proactive Detection and Resolution of Common AVD Problems
The toughest problem that any IT administrator must deal with is when a user calls with a complaint that “their virtual desktop or application is slow”. There can be several reasons why this could happen in an AVD environment. Some of the common reasons include:
- Azure outages
- Storage failures
- FSLogix attachment issues
- Space issues with FSLogix
- NIC issues on the hosts
- Under-sizing of session hosts
- Excessive resources consumed by one user
- Memory leak in an application
- Issues connecting to Azure AD
- Session hosts that are disconnected from Azure control plane
- Auto-scaling of session hosts is not happening
eG Enterprise’s out of the box monitoring for AVD includes immediate answers to these common AVD problems.

Azure Monitor for AVD vs. eG Enterprise – A Quick Comparison
| Azure Monitor | eG Enterprise |
| A lot of manual effort to set up, especially around what metrics to collect, what thresholds to set, when to get alerts, etc. | Very little manual effort. Pre-defined thresholds for metrics to be collected are already entered. |
| Difficult to estimate cost – every alert costs money; pricing different for different types of thresholds. Amount of data collected and historical storage also adds to the cost. | Easy to estimate cost. Licensing is based on number of users. No monthly billing surprises. |
| Possible to monitor multiple subscriptions but more complex to configure. Subscriptions within a tenant can be configured in a single log analytics workspace. Monitoring resources across tenants requires Azure Lighthouse. | Easy to configure to monitor multiple Azure subscriptions. |
| Cannot be used to monitor Citrix, Omnissa Horizon, or other digital workspace deployments like AWS AppStream or WorkSpaces. | Provides consistent dashboards and reports across all popular digital workspace technologies including Citrix, Omnissa Horizon, AWS AppStream and others. |
| Azure Monitors supports basic HTTP URL checks for availability. Multi-step web tests are supported with the help of Azure Application Insights. Does not include built-in simulators for AVD or other digital workspaces. Does not have full session monitoring for thick / thin clients. | Extensive in-built synthetic monitoring capabilities ranging from simple protocol checks to logon simulators for AVD and other digital workspaces to full session monitoring for thick, thin or web clients. |
| Report generation involves writing Kusto queries. | Simple reporting interface includes multiple pre-built reports. Customized reports can also be created. Users do not have to write queries. |
| Interface more suited to admins than helpdesk staff. Root-cause diagnosis and analytics are left to other tools that take feeds from Azure Monitor. | Role-based access and personalized views are supported. Helpdesk staff can easily navigate the interface and triage problems quickly. |
| Integration with ITSM tools and enterprise workflows is difficult. Manual configuration is needed. | Many out of the box integrations are available for supporting most common ITSM tools. |

How eG Enterprise Addresses the Key Needs for Monitoring Azure Virtual Desktops
Synthetic Monitoring of AVD Logon Performance and User Experience
User experience monitoring is one of the key needs for AVD admins. eG Enterprise includes a purpose built logon simulator for AVD. This browser-based tool is deployed on a dedicated VM/desktop and periodically logs into the Azure portal, launches the published desktop or application, waits for the desktop or application launch to complete and reports the success/failure of the logon attempt and the time taken for the simulation.

Simulations can be performed using different accounts (e.g., different departments using AVD), and from different locations (e.g., branches). The simulations can run 24×7 and can proactively alert IT admins to potential issues with the AVD service in advance.
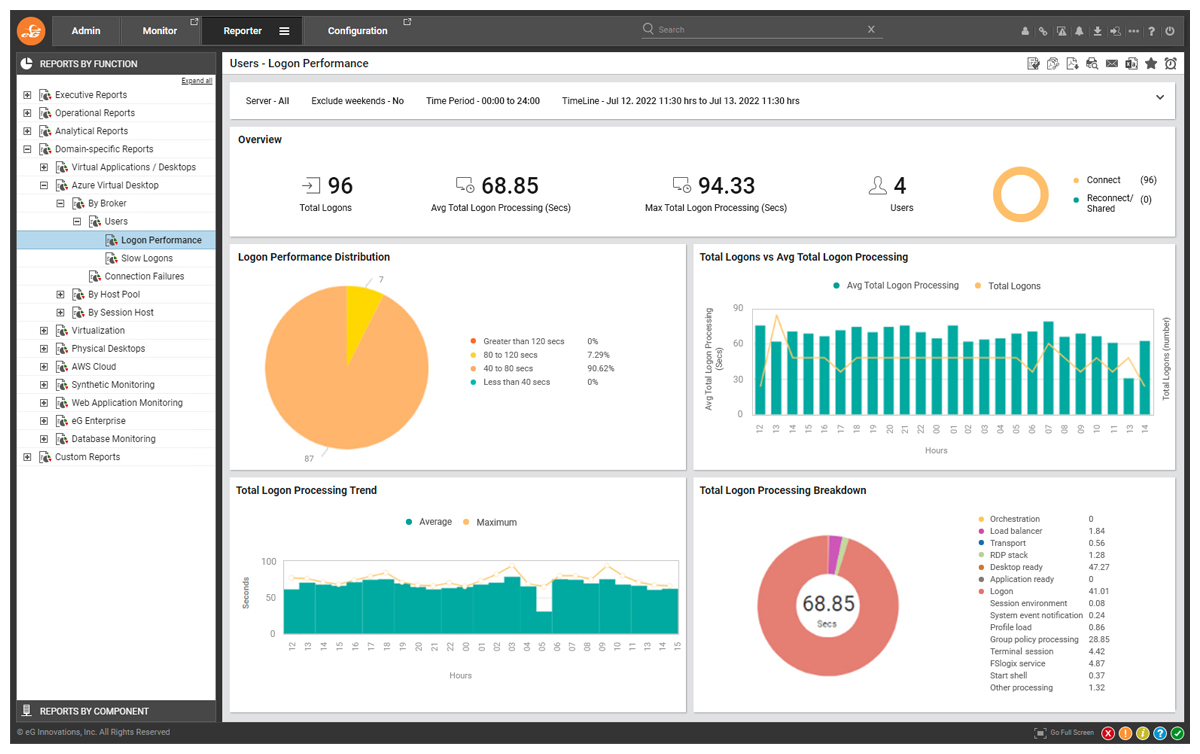
The figure below is the dashboard highlighting the results of logon simulation of AVD. In the top part of the figure, each row is a simulation. The results of the simulation are color coded. Red color highlights problems when they happen. Clicking on each row shows details of the simulation.
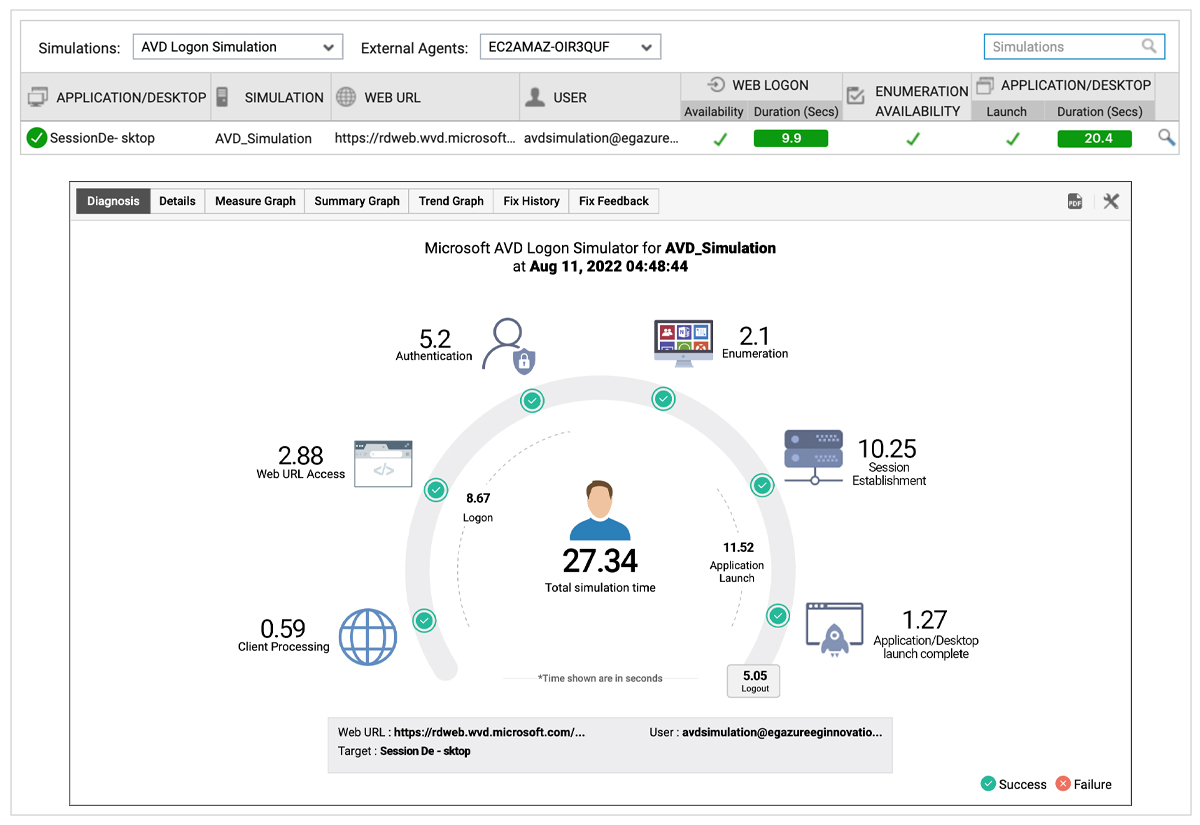
The details in the bottom half of Figure 6 highlight the time spent during simulation in each stage:
- Opening the browser
- Accessing the Microsoft portal
- Authenticating the user
- Checking if the application/desktop is enumerated (i.e., present on the page and can be accessed)
- Session establishment with the session host and application/desktop launch
The timing associated with each step can provide an indication of where slowness may arise from. For example, if authentication is slow, there could be a problem with Azure AD, and if application/desktop launch is slow, the issue could be due to a faulty GPO or a large profile, or an FSLogix issue.
Logon simulation is the easiest way to get started with monitoring Azure virtual desktops.
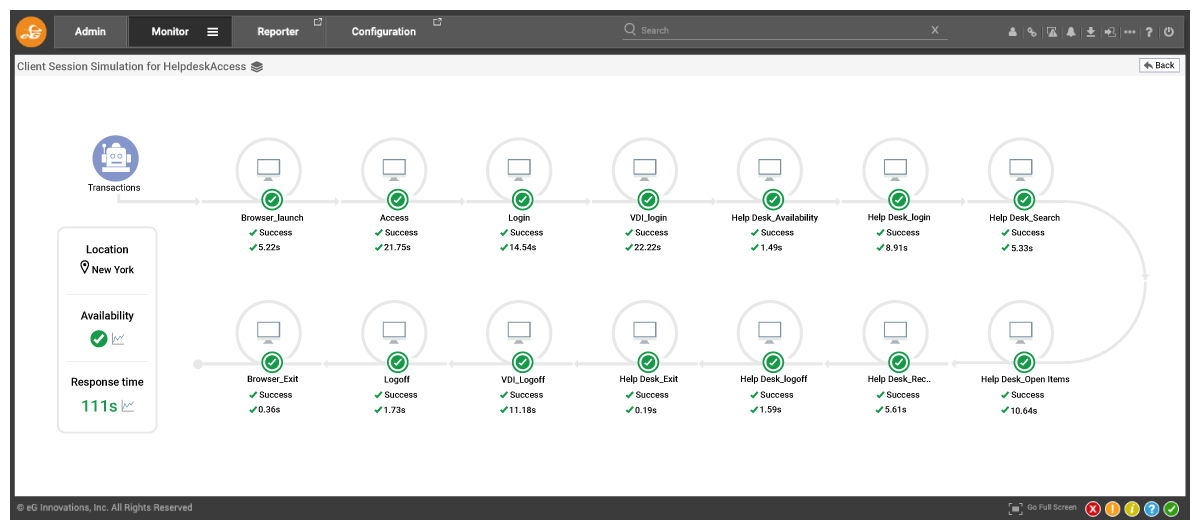
If you want to simulate AVD logons using a native client application (not a browser) or if you need to simulate user interactions beyond logon (e.g., accessing an application, logging into it, doing work in the application and then logging out), logon simulation is not sufficient.
Full session simulation in eG Enterprise supports this functionality. The workflow to be simulated must be recorded by the admin using a recording tool and then a playback tool takes care of periodically replaying the scripted actions. Figure 7 below shows a dashboard displaying the real-time status of a simulated workflow.
Real User Experience Monitoring for AVD
Synthetic monitoring alone is insufficient to proactively avoid users encountering issues or troubleshoot any issues real users encounter. After all, synthetic monitoring is performed from a limited set of locations and using a small set of user login accounts.
To get a more comprehensive picture of the user experience, it is important to monitor real user activities and their experience when accessing their applications and desktops.
Users connect to the Azure control plane and are assigned to one of the session hosts in a host pool. Since most of their activities during a session occur on a session host, user experience for a user’s session is best monitored using agents on each session host.
The agent on a session host monitors various aspects of AVD user experience:
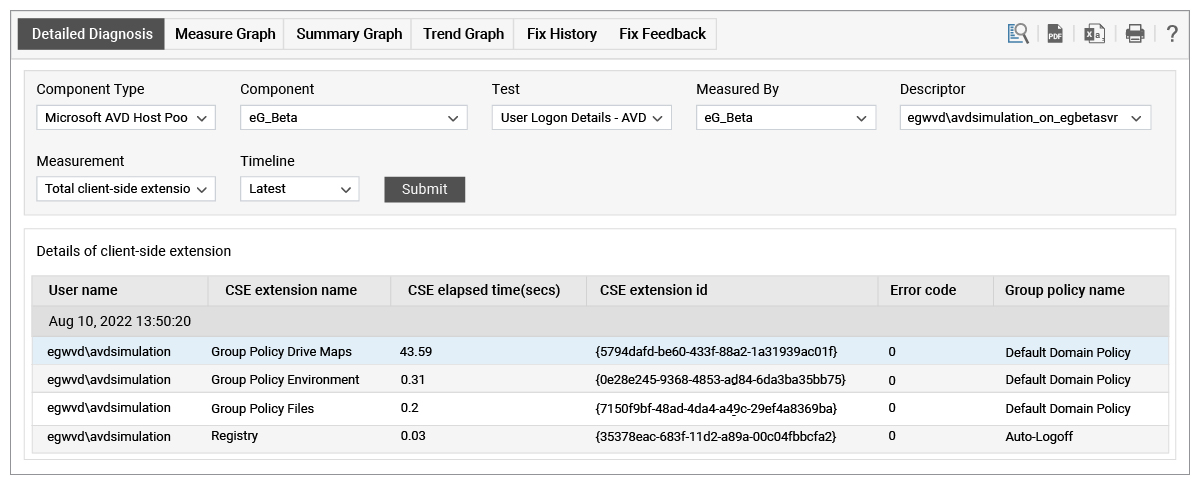
1. Windows logon duration monitoring
Windows logon happens on the session host. The user is authenticated, their profile is loaded, GPOs are processed, etc. The eG agent on a session host tracks these activities and reports the total logon processing time on the session host.

The time taken for each GPO processed is also tracked so if a particular GPO is slowing down a user’s logon, eG Enterprise will highlight it. Also note that the success/failure of GPO processing and the error code, if any, are also monitored, so administrators can easily see if GPO processing is causing AVD logon issues.
AVD uses FSLogix for profile management. If an FSLogix disk is not attached during user logon, the user’s profile may not be available. eG Enterprise’s monitoring of AVD reports the status of the FSLogix profile container – whether it is attached or not. Space usage on the container is also tracked and excessive usage is highlighted.

2. Application launch time monitoring
Slowness can occur when a user opens an application. It takes time for the application to launch and be available for user interaction. An eG agent reports this application launch time for any interactive application accessed by users. By tracking this metric, you can determine if a specific application is slow to launch, or if all applications are slow to launch on a session host, etc.

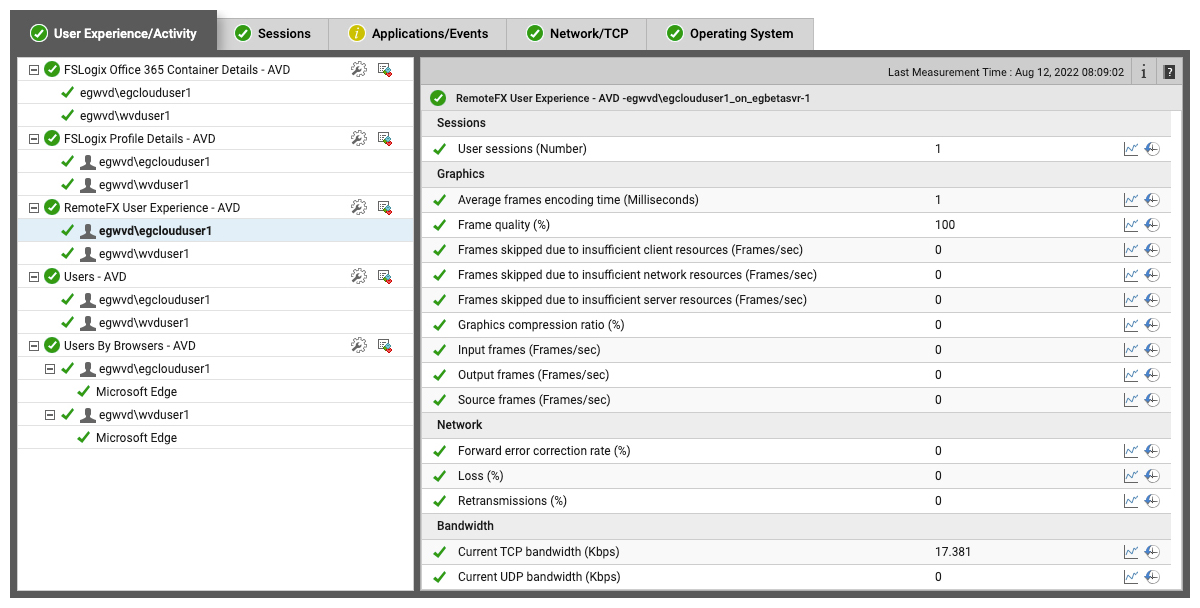
3. Protocol performance monitoring
When a user is in a session, latency and bandwidth are key metrics that determine whether the user perceives the virtual application or desktop to be responsive. The eG agent on a session host tracks:
- Frame quality
- Packet loss during transmission
- Retransmissions
- Bandwidth used for each user sessions
Frames skipped are indicative of performance degradations. The eG agent reports if frames are skipped on the client, on the server or in the network, which gives admins an idea of where the bottlenecks are. For example, if frames are skipped on the client, it is a user-end issue, not in the AVD infrastructure.
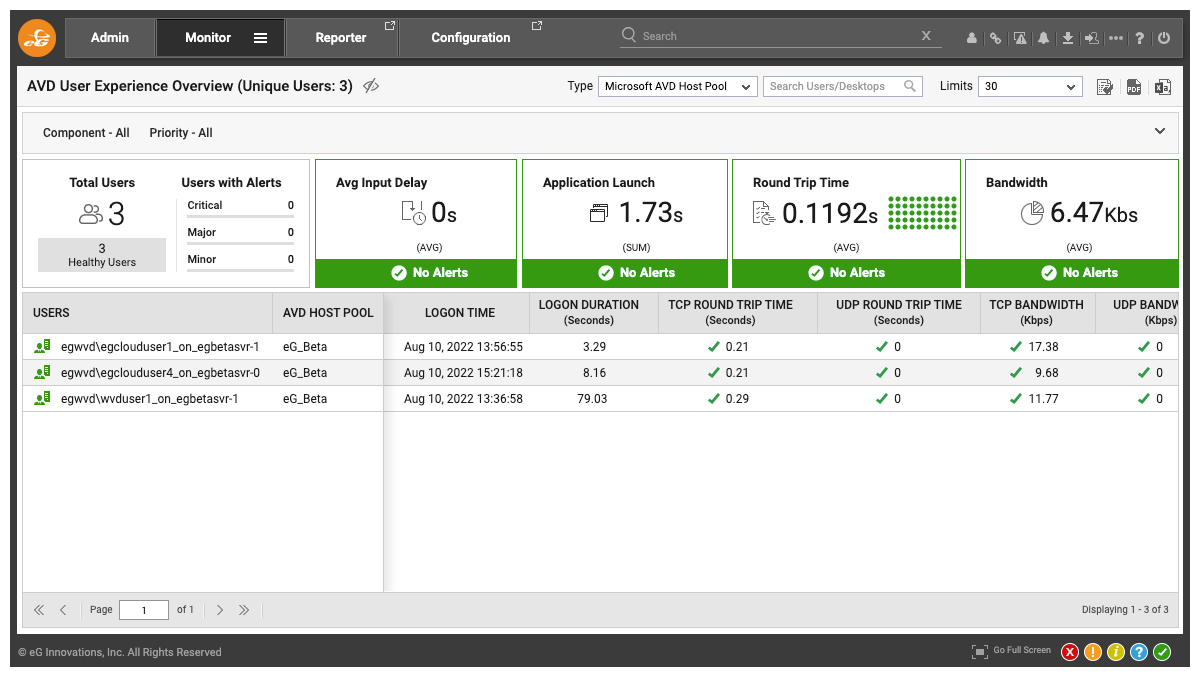
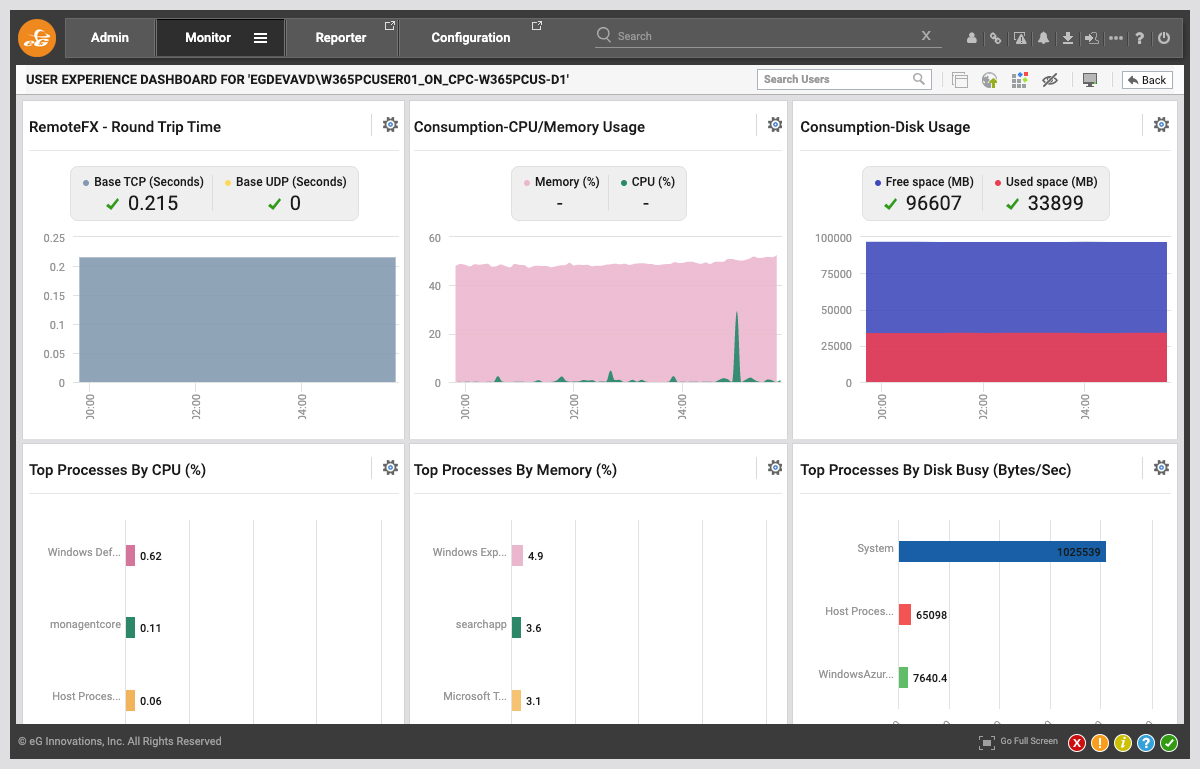
IT admins can get a quick overview of active user sessions from the User Experience Dashboard. Here, admins get to a see a quick overview of all user sessions that are active, key user experience and resource metrics for each session. They can also drill down into any session and see more details of user activity and performance in that session.
Monitoring Azure Virtual Desktop Session Hosts
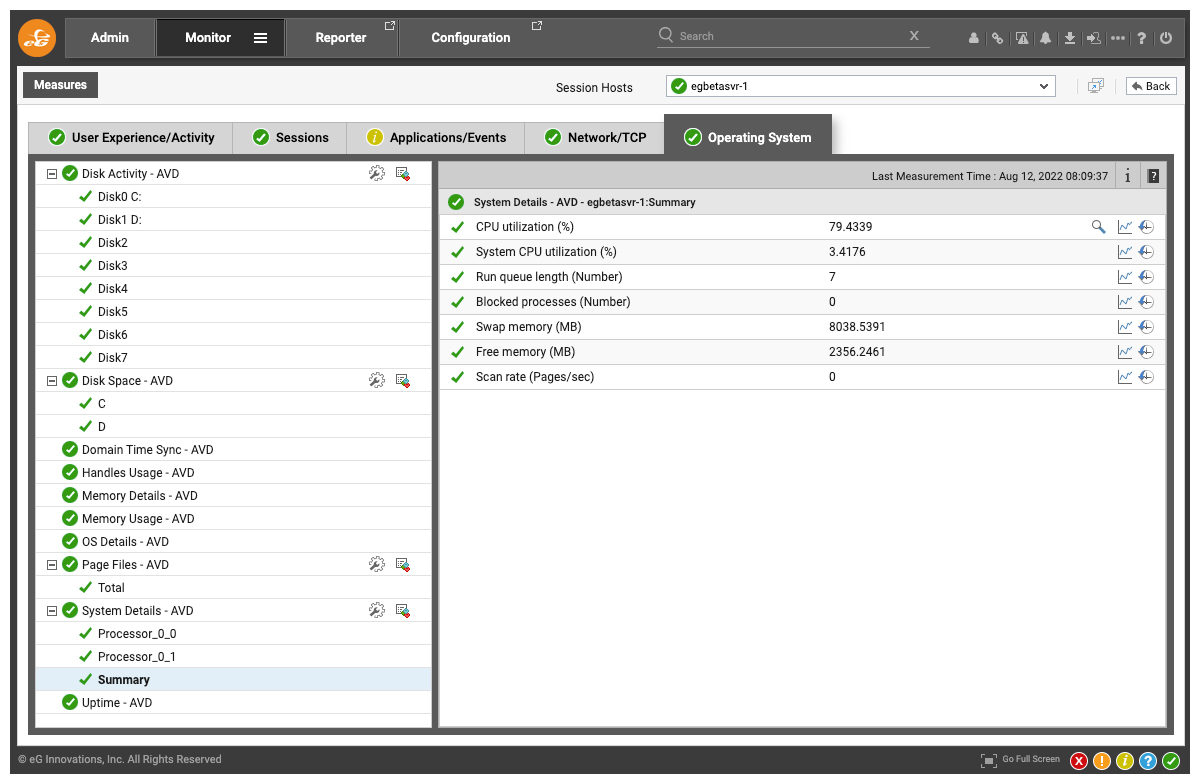
User experience issues can occur if the session hosts have resource bottlenecks, e.g., due to insufficient sizing of CPU/memory/disk resources. eG agents on the session hosts monitor all aspects of the Windows OS performance to identify and resolve OS bottlenecks.
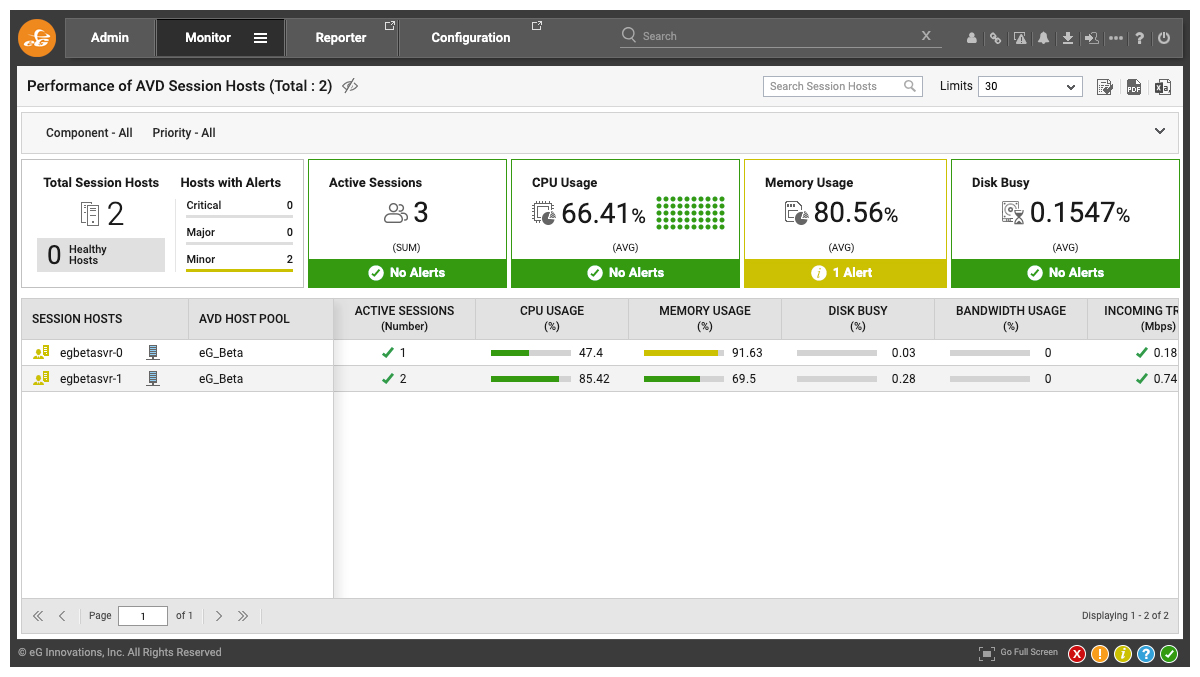
With eG Enterprise AVD admins can:
- Determine if there is a CPU or memory bottleneck and what are the top processes consuming these resources.
- Track Disk IOPS and activity with the processes causing high disk activity highlighted.
- Detect OS handle leaks and know which application is causing it. OS handle leaks can also slow down applications – e.g., if an application keeps opening a file object but doesn’t close it.
- See excessive bandwidth consumption. Network traffic to and from the session hosts is also tracked.
- Windows system, security and application event logs are monitored and critical/error events highlighted.
- Monitor session activity on the hosts. Session disconnects leave behind running processes even though a user is not active in a session. This can result in resources on the host being wasted. eG Enterprise can detect and alert to such conditions.
- Track input delay, which is the delay in processing requests from users is tracked for every session. High input delay is indicative of bottlenecks on a session host.
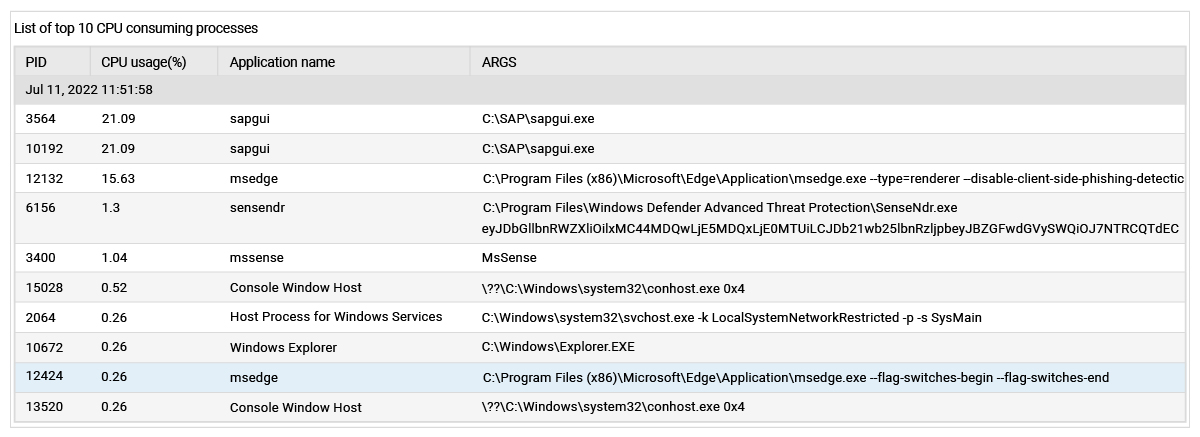
- Monitor browser activity on a session host. Resources consumed by each user/browser combination are reported and details captured include active URLs. This information can be useful for an IT admin to determine when a browser instance started consuming a lot of resources, which URLs were active?
In addition, resource usage is tracked for every user session on the session host, so if a user complains about slow performance, the administrator can easily see why.
Monitoring of Just Session Hosts is Not Sufficient for AVD

While monitoring of user experience and session hosts is important, it is just not sufficient to just monitor the session hosts. The Azure Control Plane is where a lot of decisions are taken on how to process a user request.
Monitoring of the Azure Virtual Desktop Control Plane is therefore vitally important. Users are authenticated via Azure Active Directory which means it is important to track Azure AD performance and failures. In a similar vein, the session hosts are configured in an Azure subscription. Hence, the configuration and usage levels have to be tracked in the Azure subscription.
| To get a complete view of your AVD deployment, it is important to monitor:
|
While eG Enterprise uses agents on the AVD session hosts, monitoring of the Azure control plane, the Azure subscription and Azure AD is done agentless. If you are using a hybrid identity management approach then you need Azure AD Connect to integrate your on-prem Active Directory and Azure AD. eG Enterprise monitors Azure AD Connect in an agent-based manner.
Monitoring of Azure Connection Brokering
One of the key components of the Azure Control Plane is the Azure Virtual Desktop Connection broker which is responsible for scaling up/down session hosts and for allocating users to the session hosts. For monitoring the AVD broker, eG Enterprise tracks:
- Errors of different types for each host pool: Connection errors, feed errors, management errors, and service errors.
- Connections in different states (e.g., connected, completed, failed, etc.) by host pool.
- The health status of all the session hosts – e.g., domain joins, URL checks, healthy hosts, etc.
- Logon performance for users. The complete user logon processing is visible only to the connection broker because it is the one handling all stages of the logon process.

Monitoring of Azure AD
Monitoring, managing and auditing the entire authentication stack is critical in an AVD deployment to not only ensure users can access their applications and workspaces but to ensure a secure system where only authorized services and users can access resources and data.
Tasks such as checking App Client Certificates are often implemented via PowerShell scripts by administrators. eG Enterprise removes the need to write and maintain custom scripts, helping to improve ITOps efficiency. With eG Enterprise, IT teams can:
- Proactively monitor and be alerted on Azure AD App Client Secret and Certificate expirations
- Identify unassigned directory roles
- Identify users who are inactive or have not signed in ever
- Track users whose passwords are not expiring
- Audit user updates, password changes, application updates, service principal updates, etc.
- Learn about audit failure activities
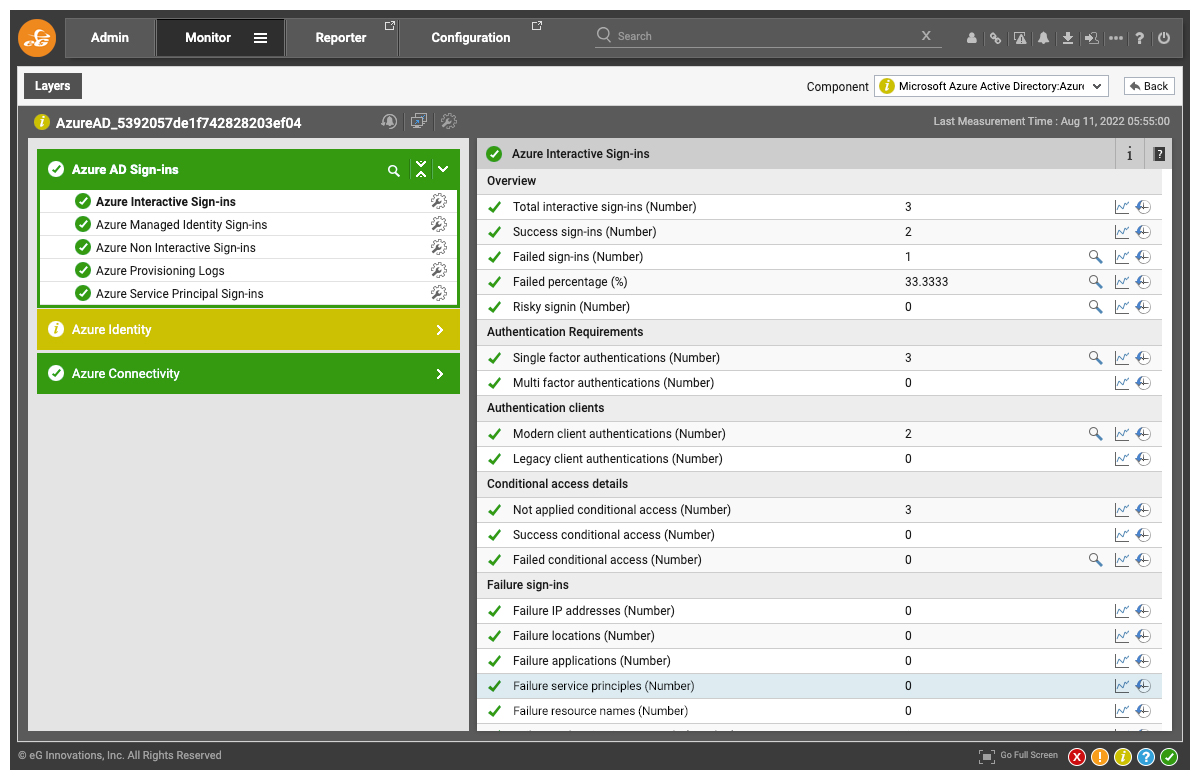
- Track different sign-in logs include service principal, interactive, managed identity and non-interactive sign-in logs. Failed sign-ins, conditional access failures, etc. are highlighted
Monitoring of the Azure Subscription
Session hosts are provisioned in an Azure subscription. Tracking of resource usage levels of the hosts relative to the resources provisioned to them must be done via Azure APIs associated with a subscription.
eG Enterprise monitors all key aspects of an Azure subscription. Storage bottlenecks are detected by monitoring availability, used capacity for files, blobs, tables and queues, ingress and egress traffic from the storage account and latencies for access. Besides native Azure storage, NetApp file volumes and file capacity pools are monitored.
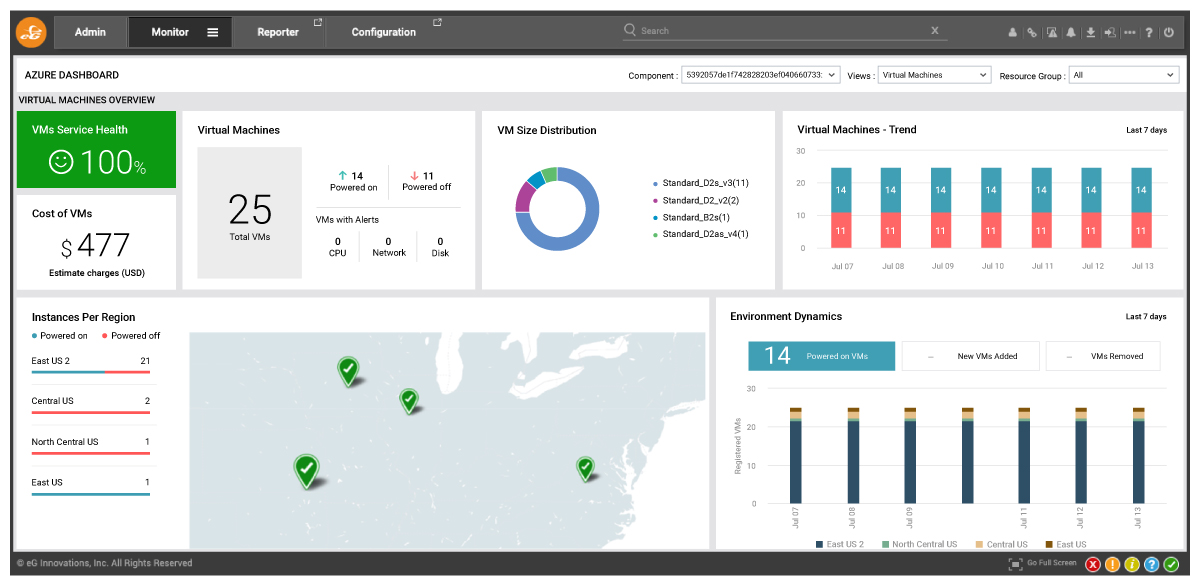
For each VM, CPU usage, disk IOPS and network traffic are tracked. By comparing these metrics across VMs, IT teams can identify which VM is consuming the most resources.
Finally, eG Enterprise also tracks billing metrics as well as Azure Advisor insights to give a single pane of glass from where IT teams can monitor all aspects of their Azure subscription.
Auto-Discovery and AIOps Capabilities
Auto-discovery capabilities make eG Enterprise simple to provision. Install agents on your session hosts and have your host pools auto-discovered. Alternatively, configure your Azure subscription and the host pools and session hosts are auto-discovered.
eG Enterprise embeds AIOps capabilities to make it easy to monitor, diagnose and report on AVD environments. Any of the metrics collected can be auto-baselined based on time of day, day of month characteristics. This means that when usage is normally high, like on a Monday morning, you don’t get alarm floods because you expect resource consumption to be high.
Service topology views within eG Enterprise show the dependencies between different tiers and are used for auto-correlation.
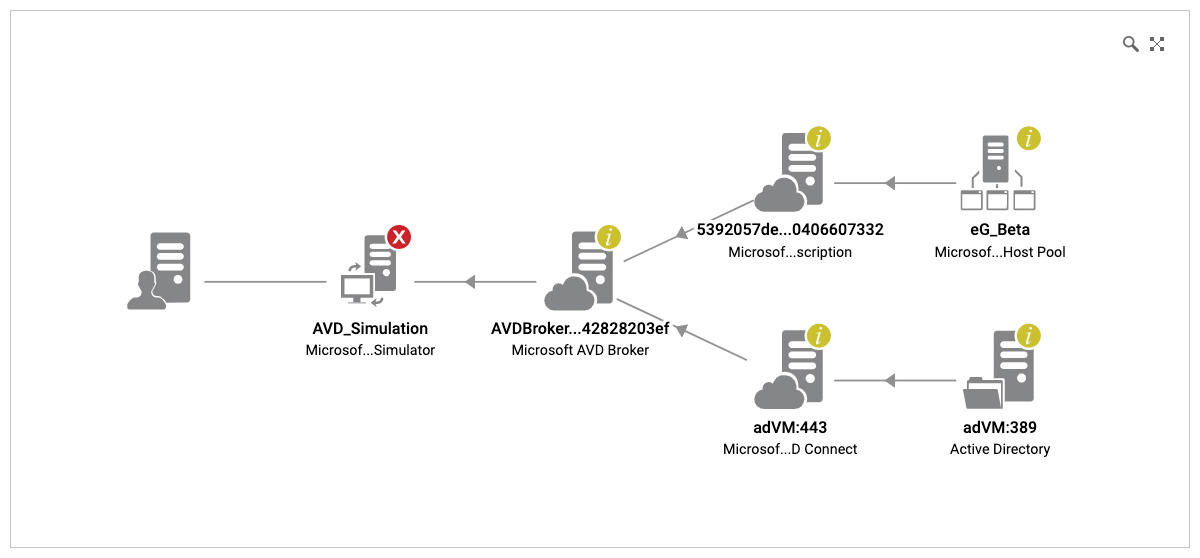
inter-dependencies between them
Pre-defined reports are available out of the box with the solution. Without needing to learn any query language or to write scripts, IT admins can quickly access various reports of interest.
Common questions like who accessed the AVD environment, when, for how long, what applications did they access, and what resources they used can be answered using built-in reports that are accessible in a few clicks.
eG Enterprise reports also assist with post-mortem analysis of problems and can be used for historical reporting and trending as well.
eG Enterprise is an Observability solution for Modern IT. Monitor digital workspaces,
web applications, SaaS services, cloud and containers from a single pane of glass.
Conclusion
Widespread adoption of Azure virtual desktop technology is on the horizon. Organizations deploying AVD will need simple and effective ways to monitor AVD. In this blog, we discussed why specialized tools are required for monitoring Azure Virtual Desktop. We compared Azure Monitor and eG Enterprise and their capabilities for ensuring seamless AVD performance through comprehensive diagnosis and reporting.
eG Enterprise is an Observability solution for Modern IT. Monitor digital workspaces,
web applications, SaaS services, cloud and containers from a single pane of glass.

