


How to set up Azure Monitor to use a Log Analytics Workspace?
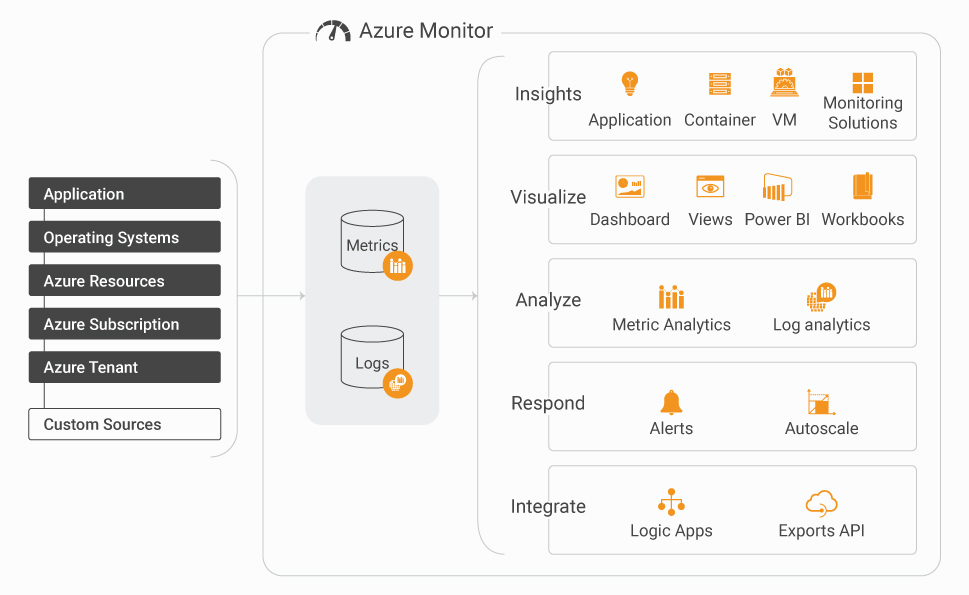
At the end of March 2021, Microsoft released Azure Monitor for Windows Virtual Desktop (AVD) for General Availability. Built upon Azure Monitor Workbooks to give insights into the Windows Virtual Desktop environment, including: Connection Diagnostics, Connection Performance, Host Diagnostics, Host Performance, Utilizations, Users, Clients and Alerts.
 I was recently inspired by Citrix Expert, Rob Beekmans posting that it is an obstacle when getting started for his customers to evaluate their monitoring and analytics costs.
Since eG Innovations has an out-of-the-box solution for monitoring Microsoft Azure and AVD that’s priced by named or concurrent users, I decided to set myself the challenge to see how hard it actually was in comparison to evaluate cloud monitoring/analytics costs, in this case on Azure, which are essentially based on a pay-as-you-go (PAYG) basis on how much data monitoring you do and how much analysis / alerting is done on that data and how long you keep the data. This blog is the first chapter in my story of my adventure with some pointers for those looking to do something similar.
First, I had to set up Azure Monitor, starting from the point where I already had a AVD host pool and VMs deployed, so this is a description of how I plugged the Log Analytics in. If you have already managed to do this for yourself – I’ll be covering how to set alert thresholds on metrics and how to estimate the costs in a later blog. This blog should however cover how to setup a Log Analytics Workspace and connect it to Azure Monitor to collect and store monitoring data from a AVD Host pool.
Background on Azure Log Analytics Workspace
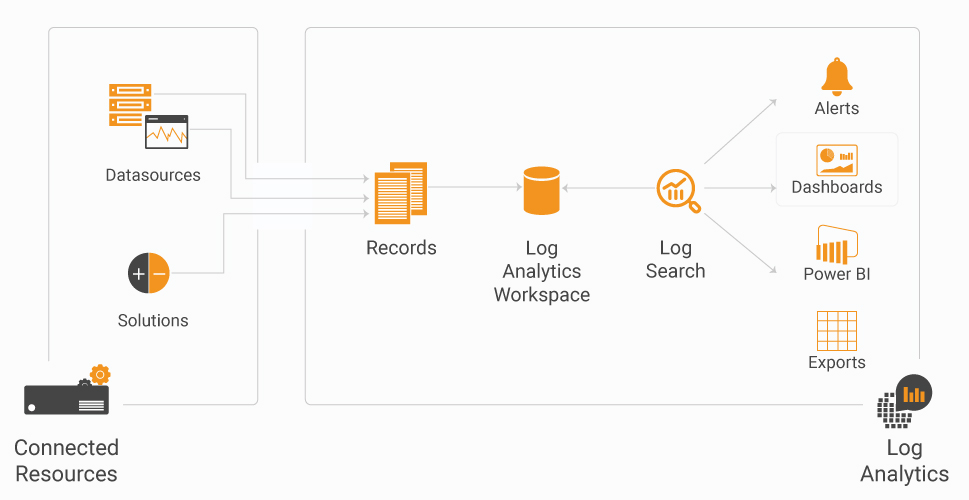
Before getting started, you will need to know what a Log Analytics Workspace is. A Log Analytics workspace is a unique environment for Azure Monitor log data. Each workspace has its own data repository and configuration, and data sources and solutions are configured to store their data in a particular workspace.
It is also worth being aware that the Azure portal documentation will also refer to “blades”, Microsoft’s own documentation style guide says “Use blade to refer to a pane in the Azure portal. Avoid talking about blades. Instead, try to discuss what the customer needs to do. When you must mention a blade: Always name the blade except in general references to a blade or blades.” Basically, blades are consistent management pages that let you manage Azure’s services through a consistent way of exposing settings, actions, billing information, health monitoring and usage data and so on.
Azure Virtual Desktop is still a relatively new product and is evolving rapidly, particularly around monitoring, as such the interface does seem to change fairly frequently and there are quite a few beta features available. This article was written in May 2021 and I do expect that the procedures involved will change further.
Getting Started with Monitoring WVD Host pools in Azure
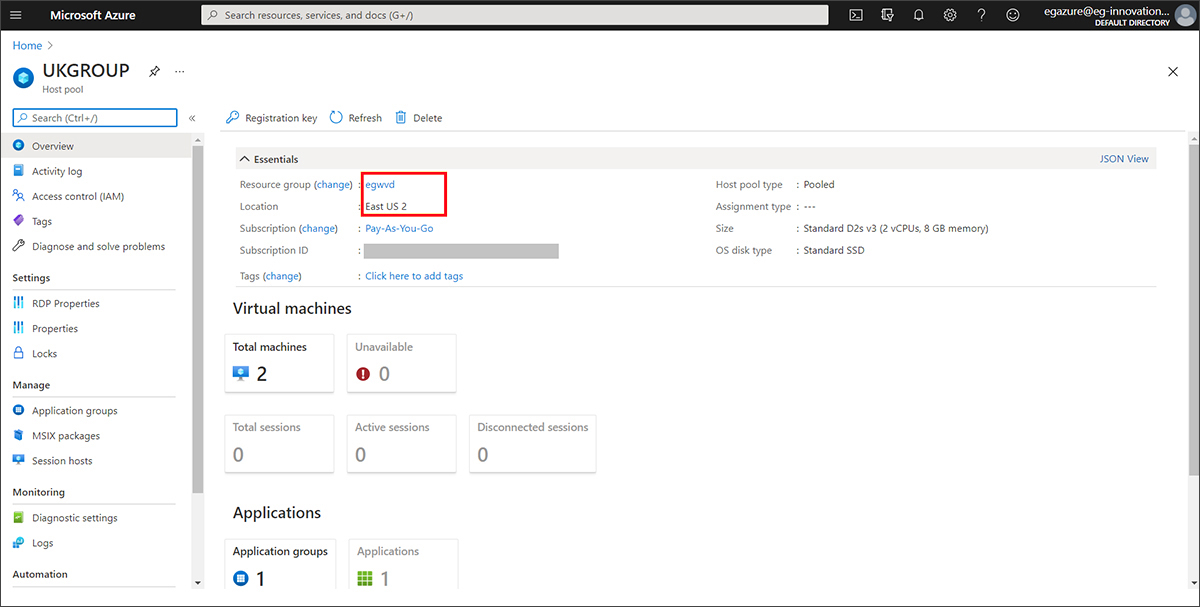
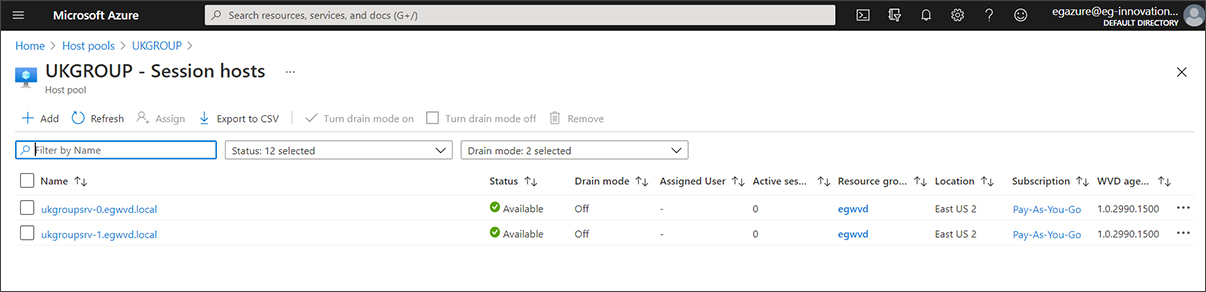
I started with an existing host pool named “UKGROUP” containing two AVD session hosts within a resource group “egwvd” located in the Azure region “East US 2”.
Step 1: Create a Log Analytics Workspace
An Azure Log Analytics Workspace is required to enable Azure Monitor for AVD. You will probably want to create a dedicated Log Analytics Workspace for your Windows Virtual Desktop environment, to which you will add only those VMs within the AVD environment. This will ensure you collect performance counters, metrics and logs from only the AVD session hosts rather than the wider Azure environment you may have, as this could add unnecessary cost. A Log Analytics Workspace is a unique environment for Azure Monitor log data. Each workspace has its own data repository and configuration, and data sources and solutions are configured to store their data in a particular workspace.
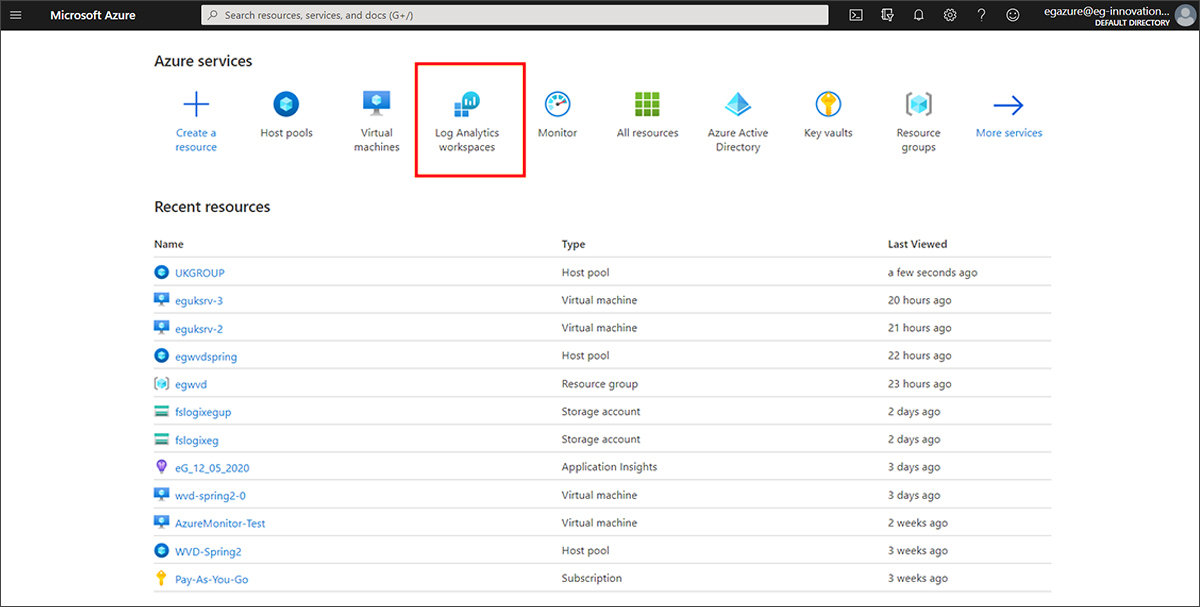
Login to the Azure Portal via Home – Microsoft Azure.
In the Azure Portal, click All Services and select Monitors from the list of services displayed. Once you click Monitors a group of resources under monitors will be displayed. Select Log Analytics Workspace from the group of resources displayed. I followed the steps detailed, here, to create the Log Analytics Workspace: Create a Log Analytics workspace in the Azure portal – Azure Monitor | Microsoft Docs
From portal home page I navigated via the “All Services” options, by clicking on the Log Analytics icon
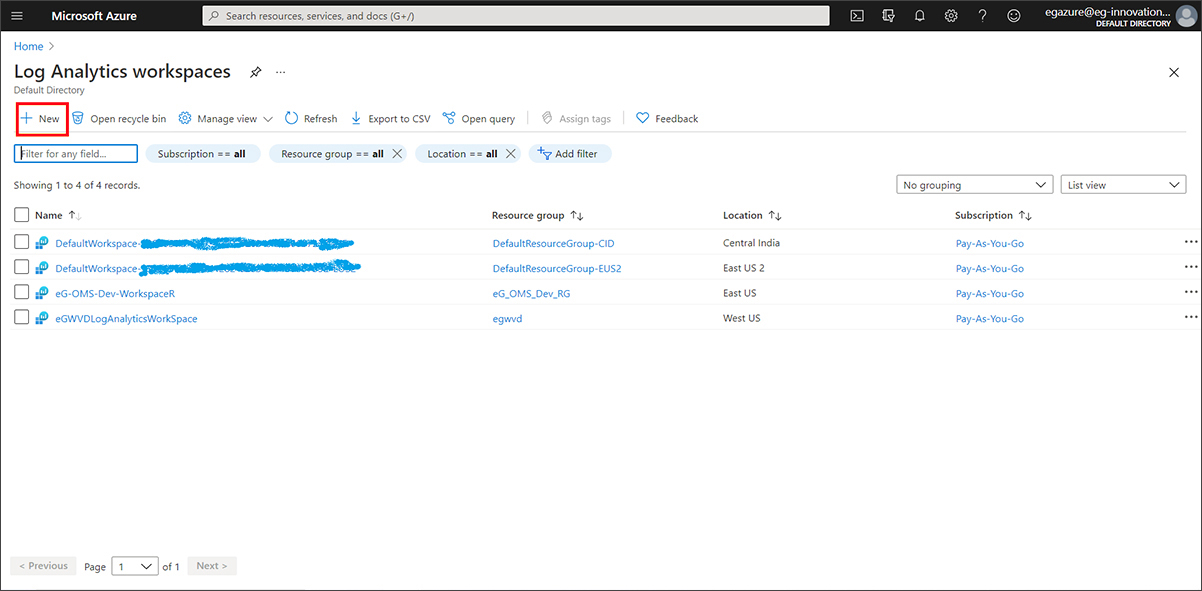
Within the Log Analytics Blade, click New
And created my new workspace, named “Rachels-LogAnalyticsWorkspace”, within the same resource group “egwvd” that my host pool resided in, by default Azure proposed I locate the workspace in a different region to my host pool so I changed the region to be “East US 2” manually.
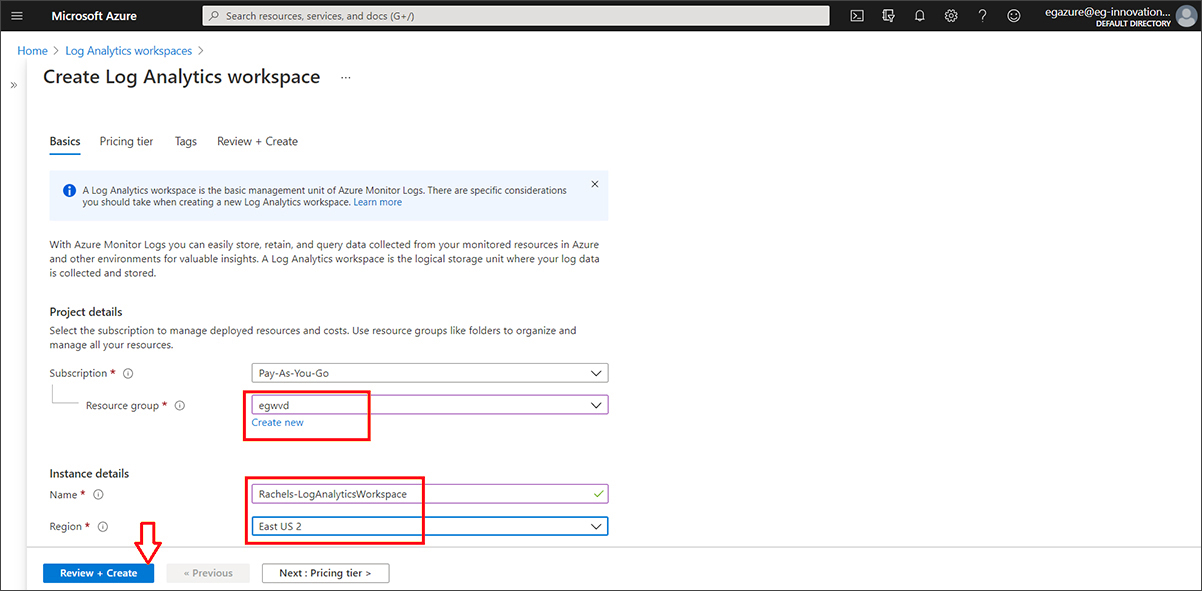
Once I had done this, I clicked Review + Create
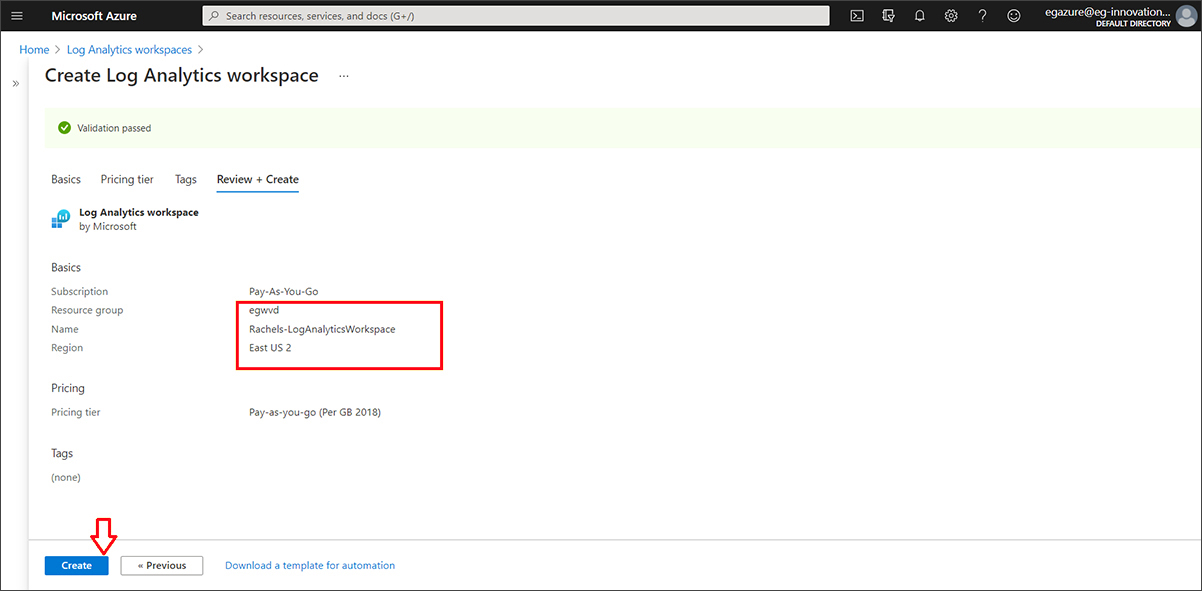
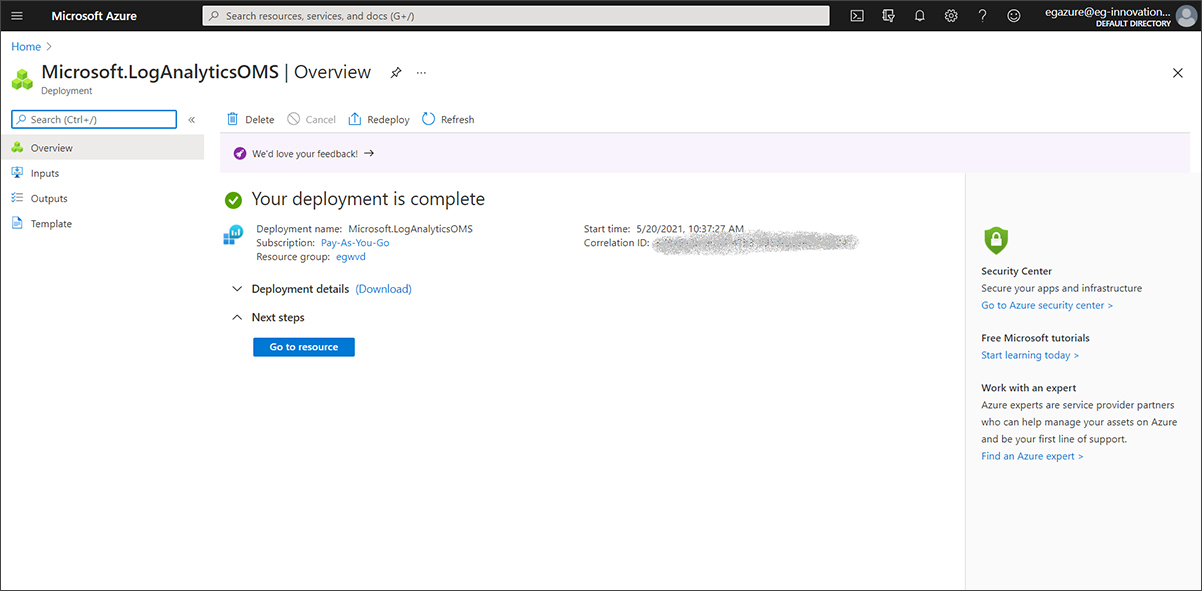
If the details look correct, you just need to click Create, you will see some messages about deployment appear, and hopefully be presented with a message indicating you have been successful
Step 2: Open Azure Monitor for Azure Virtual Desktop
You can open Azure Monitor for Azure Virtual Desktop with one of the following methods:
- Go to ms/azmonwvdi. The Insights icon can be found on the left-hand side menu (See screenshot below)
- Search for and select Windows Virtual Desktop from the Azure portal, then select Insights.
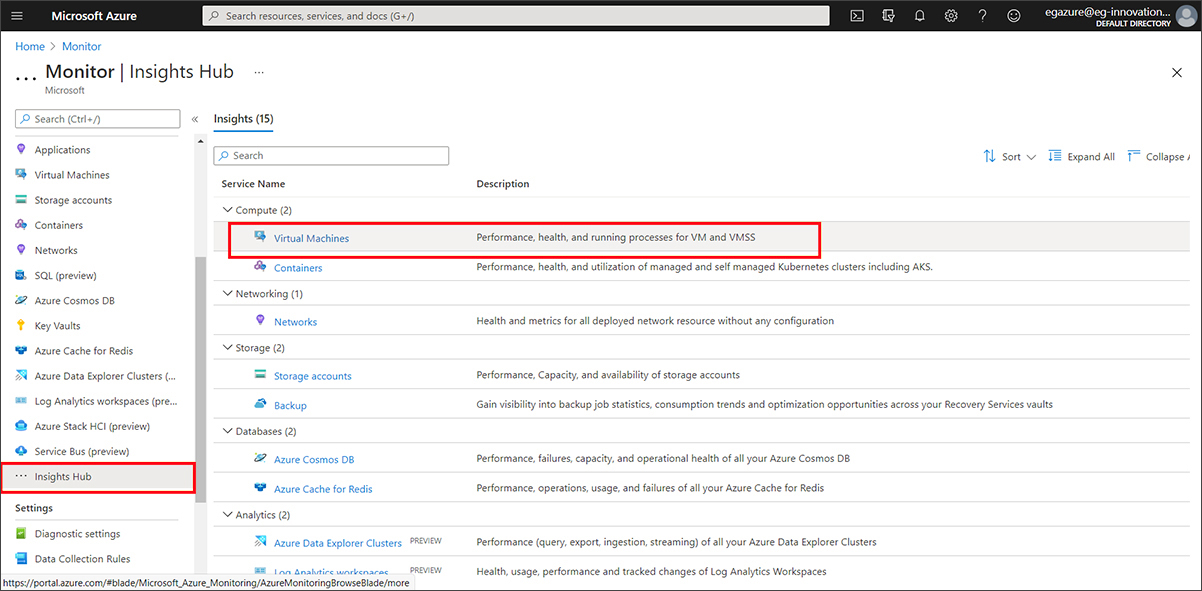
- Search for and select Azure Monitor from the Azure portal. Select Insights Hub under Insights, then select Windows Virtual Desktop.
In general, the Microsoft documentation is riddled with quick links similar to “aka.ms/azmonwvdi” above, that will take you the correct view. This is often easier than figuring out how to navigate via the objects themselves.
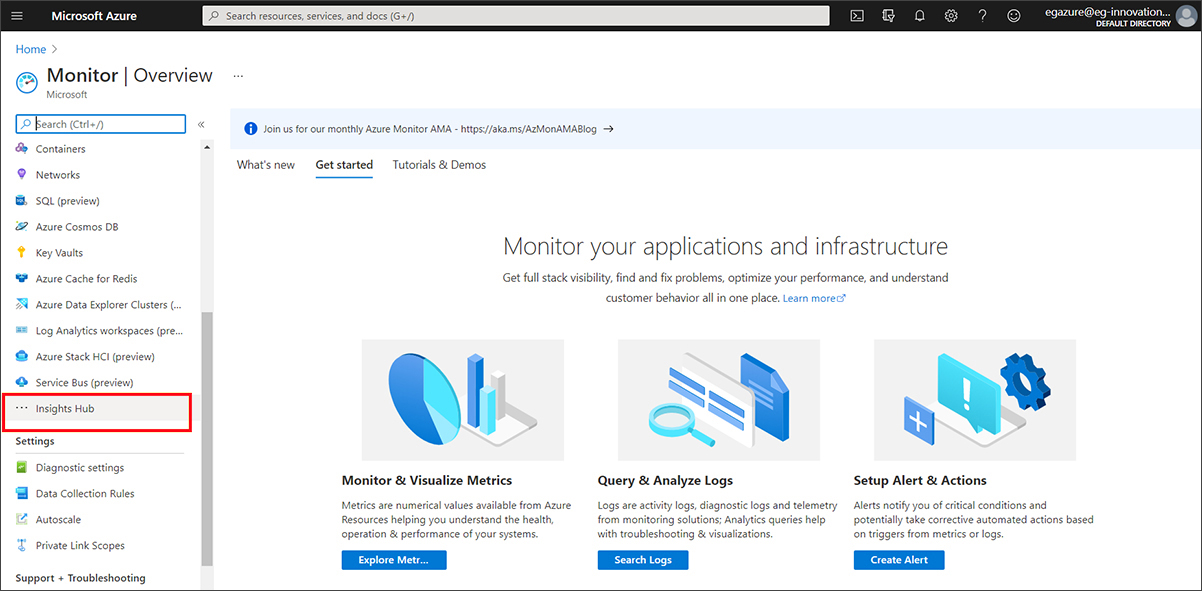
Note the Insights section of the menu and Insights Hub will be towards the bottom, you may need to scroll to find it.
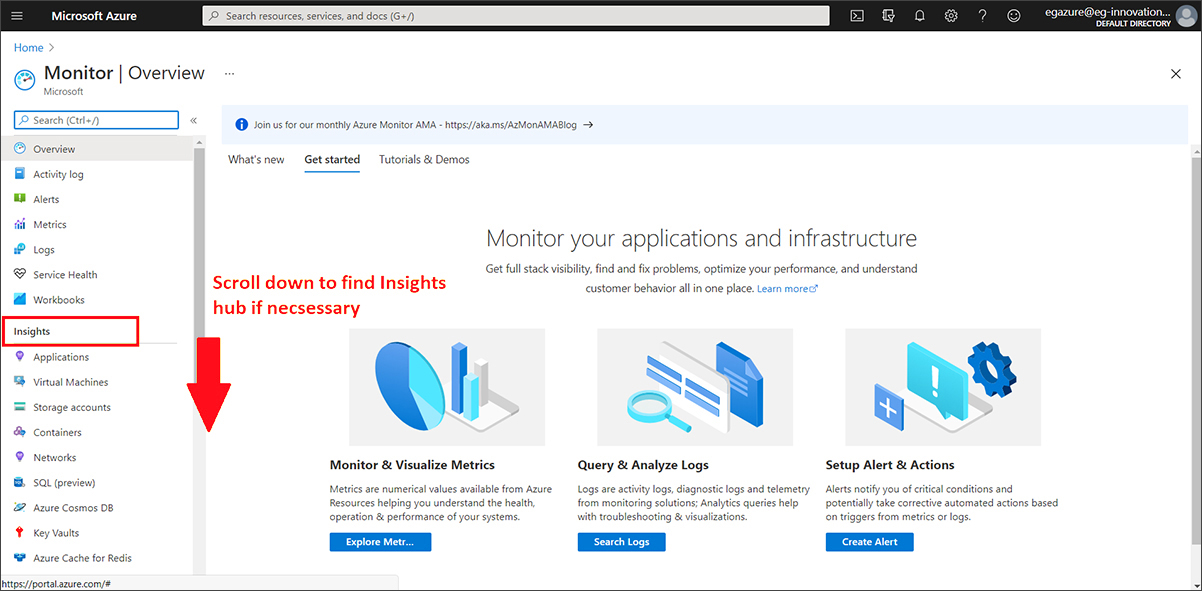
Click on Insights hub:
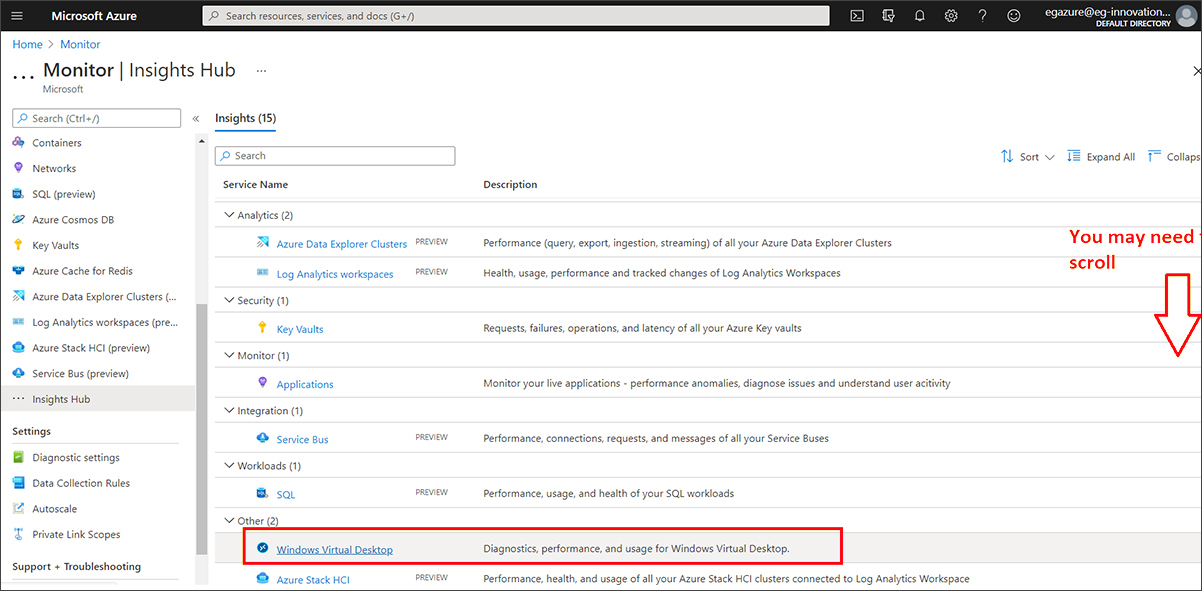
Now you can choose to add the Windows Virtual Desktop monitoring functionality, you may need to scroll to find it located currently under “Other”
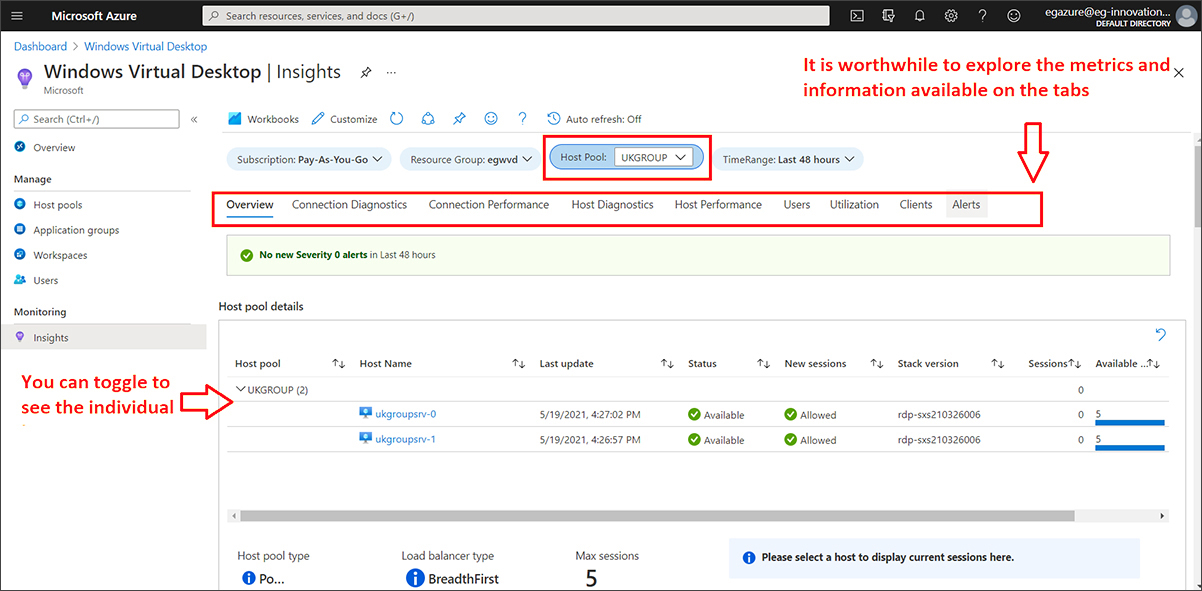
Once you have the page open, enter the Subscription, Resource group, Host pool, and Time range of the environment you want to monitor. You will see some messages about things which aren’t configured.
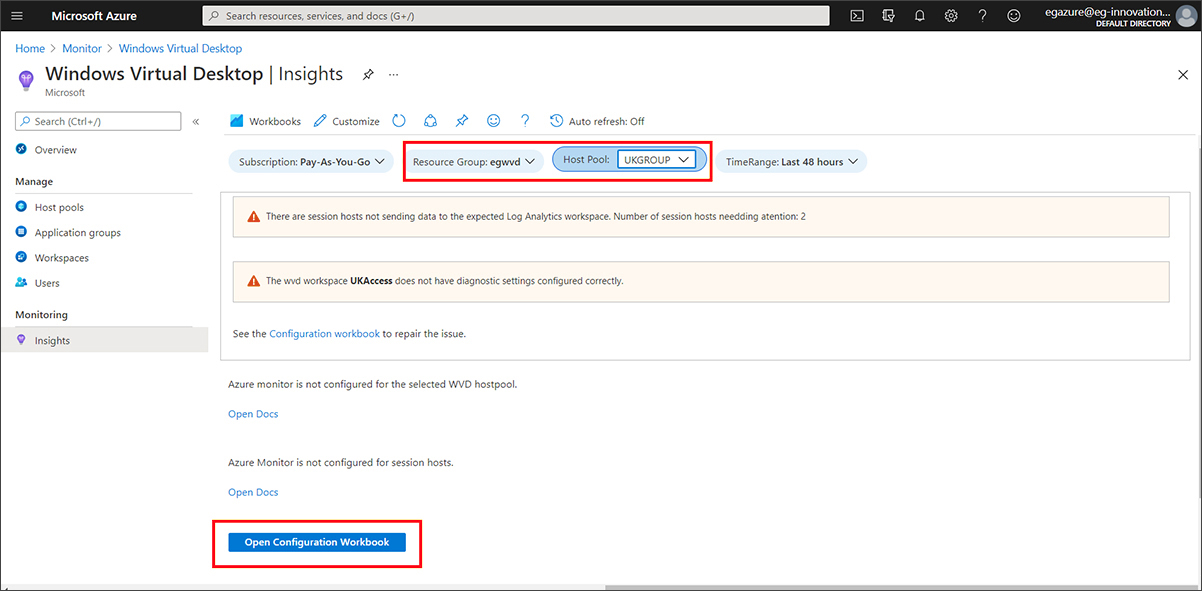
Now click Open Configuration Workbook where you will be able to enable data collection for the following things in your Log Analytics workspace:
- Diagnostics from your Windows Virtual Desktop environment
- Recommended performance counters from your Windows Virtual Desktop session hosts
- Recommended Windows Event Logs from your Windows Virtual Desktop session hosts
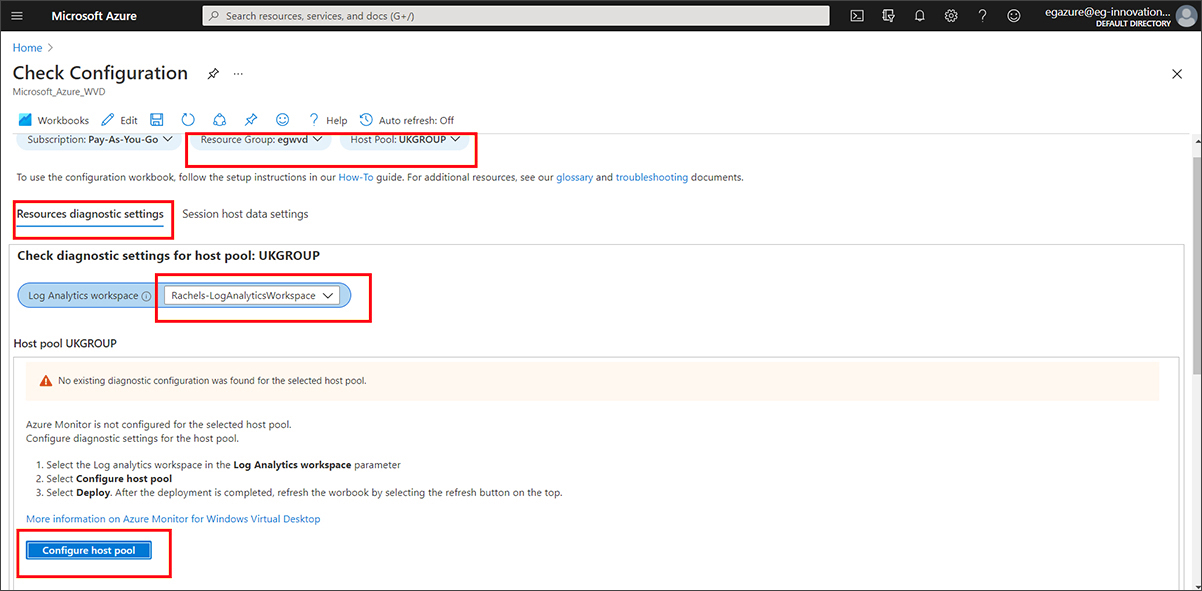
Step 3: Set up using the configuration workbook
The configuration workbook sets up your monitoring environment and lets you check the configuration after you’ve finished the setup process. It’s important to check your configuration if items in the dashboard aren’t displaying correctly, or when the product group publishes updates that require new settings.
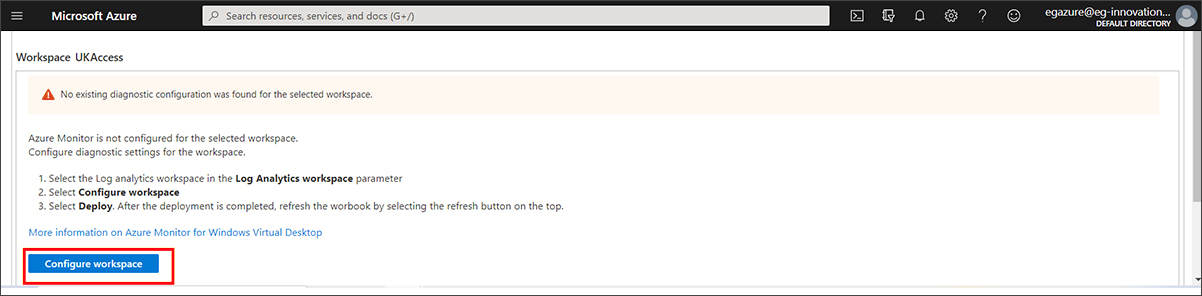
On the Resources diagnosis settings tab, select the Log Analytics Workspace (“Rachels-LogAnalyticsWorkspace”) created in step 1 (above) and click the Configure host pool button.
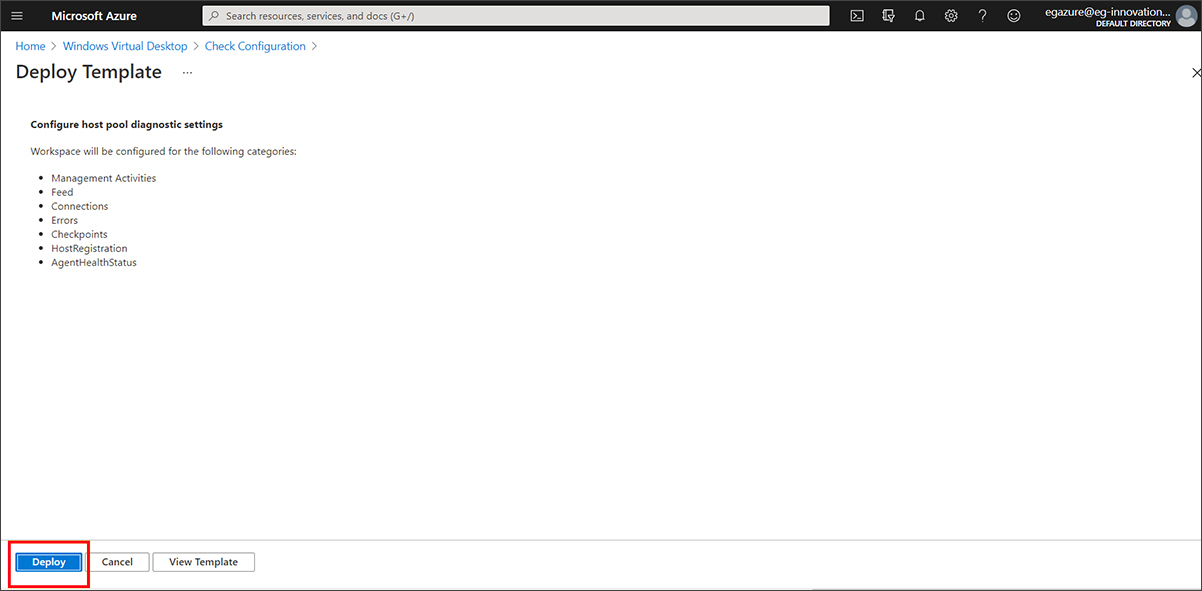
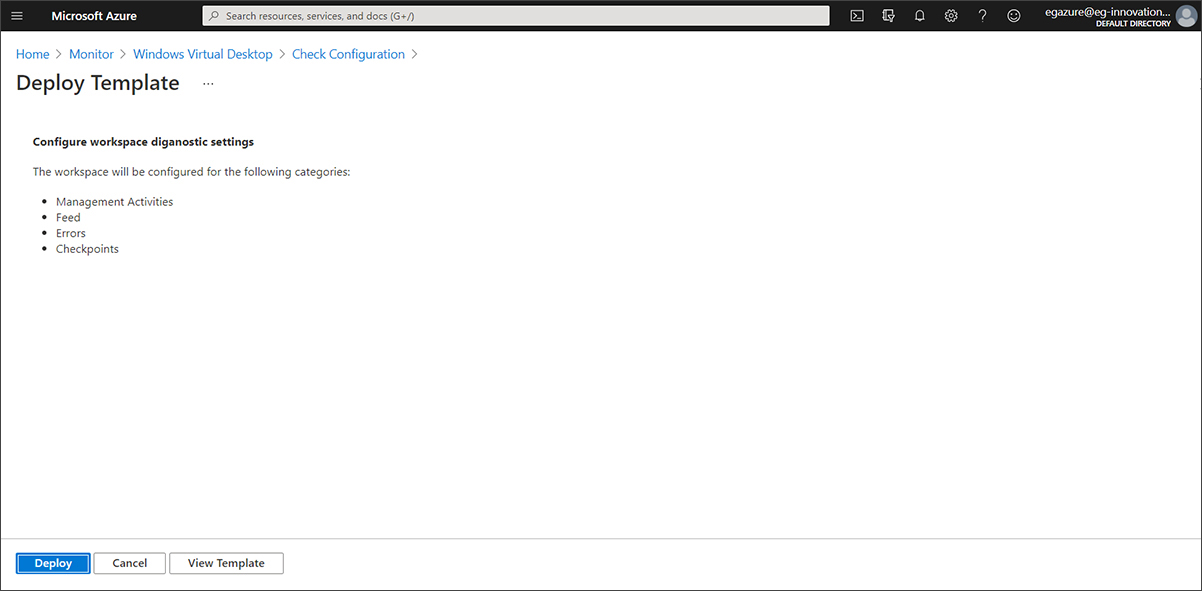
The next screen will inform you what data will be collected, click Deploy.
After the deployment, the details of the deployment will appear,
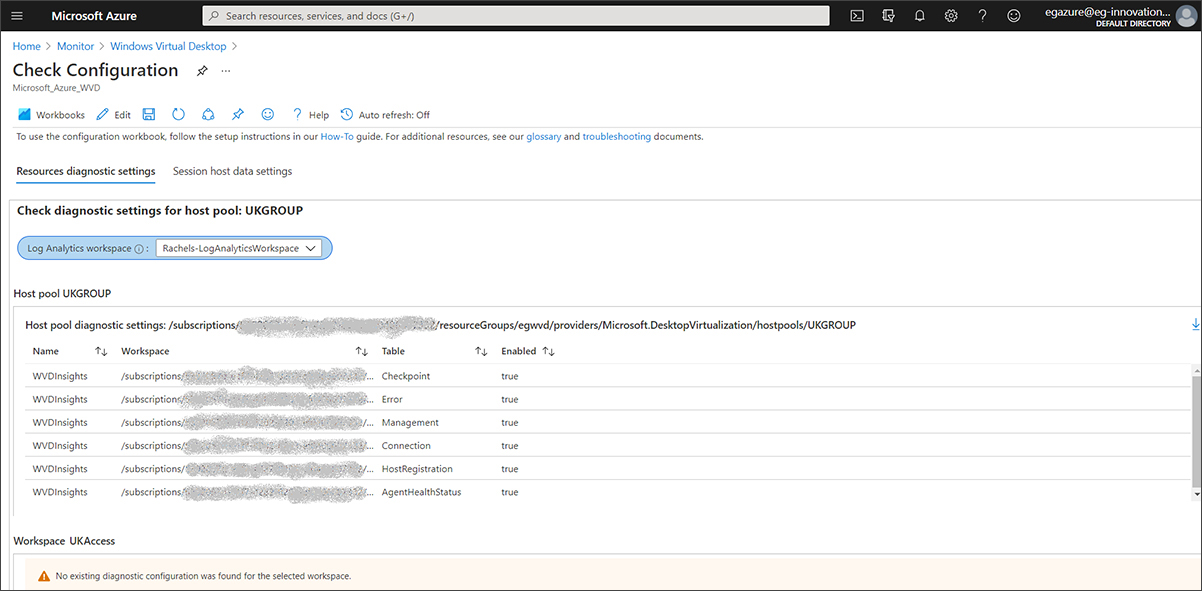
You may need to scroll down a little to find the Configure workspace button, click on this.
Now click on Deploy.
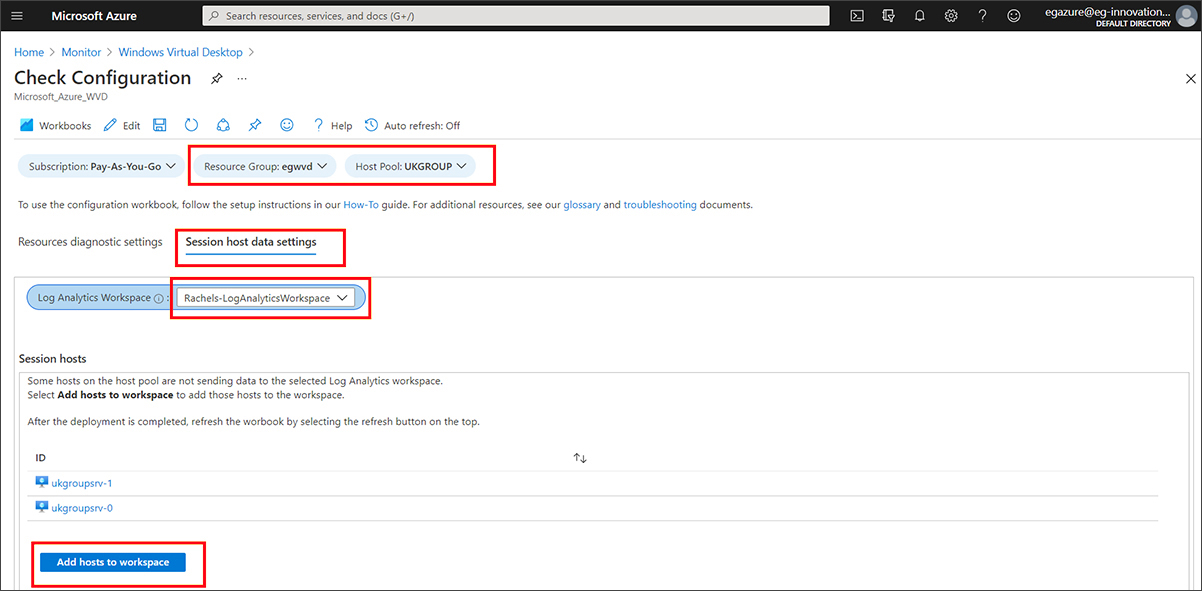
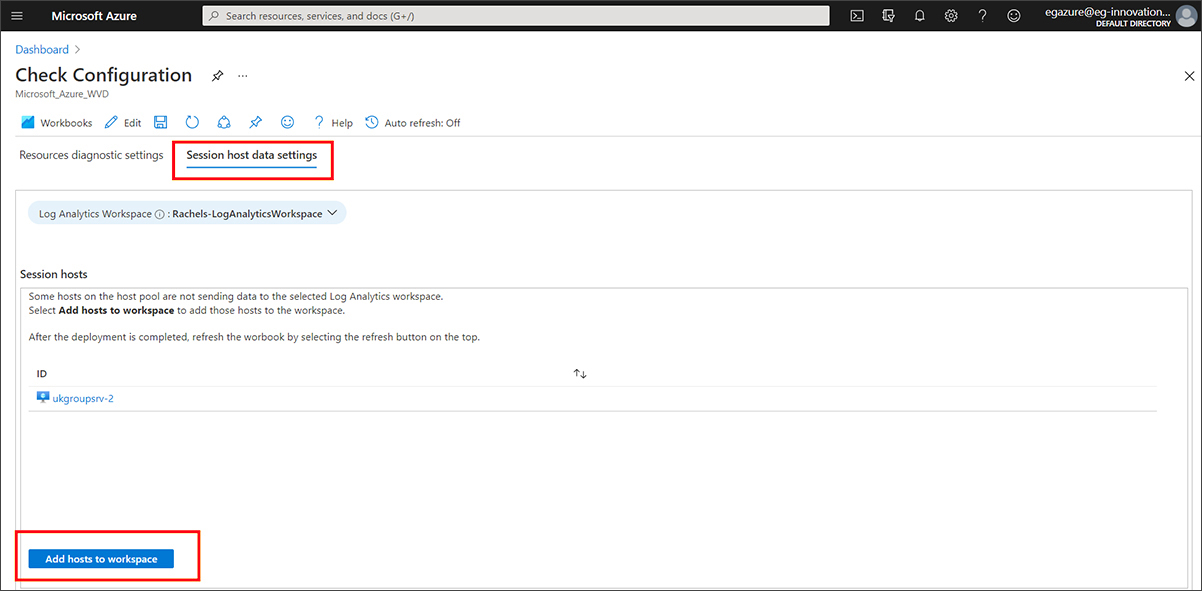
Once deployed, switch to the Session host data settings tab and select the Log Analytics Workspace (in my case “Rachels-LogAnalyticsWorkSpace”) again. Now you can connect the VMs from the Host Pool to the Log Analytics Workspace. Click Add hosts to workspace.
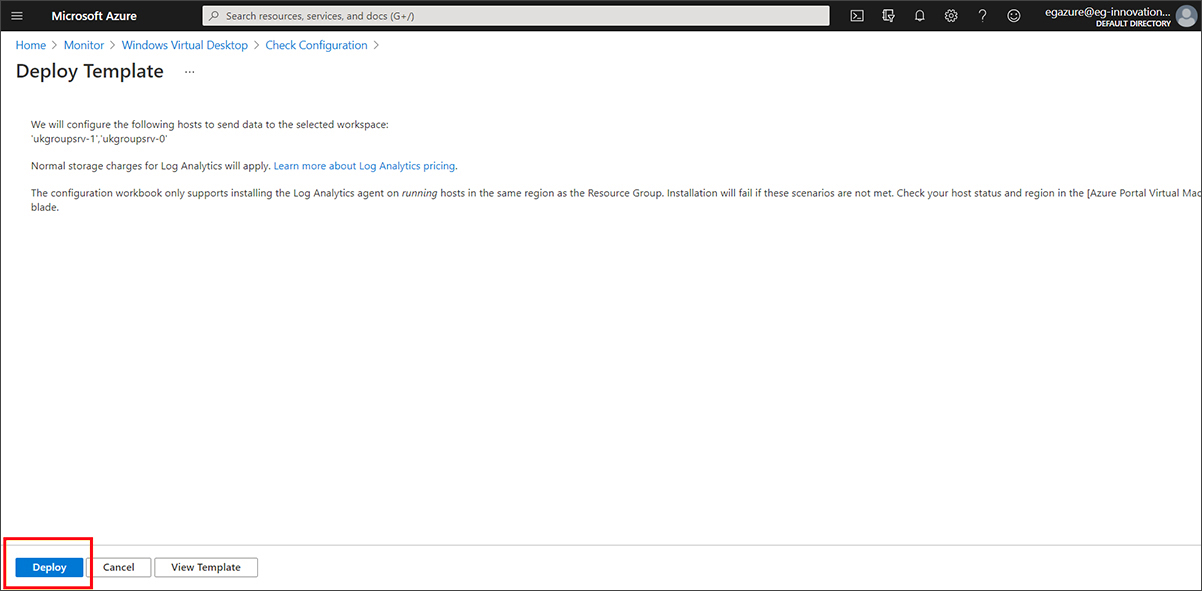
Again, click Deploy.
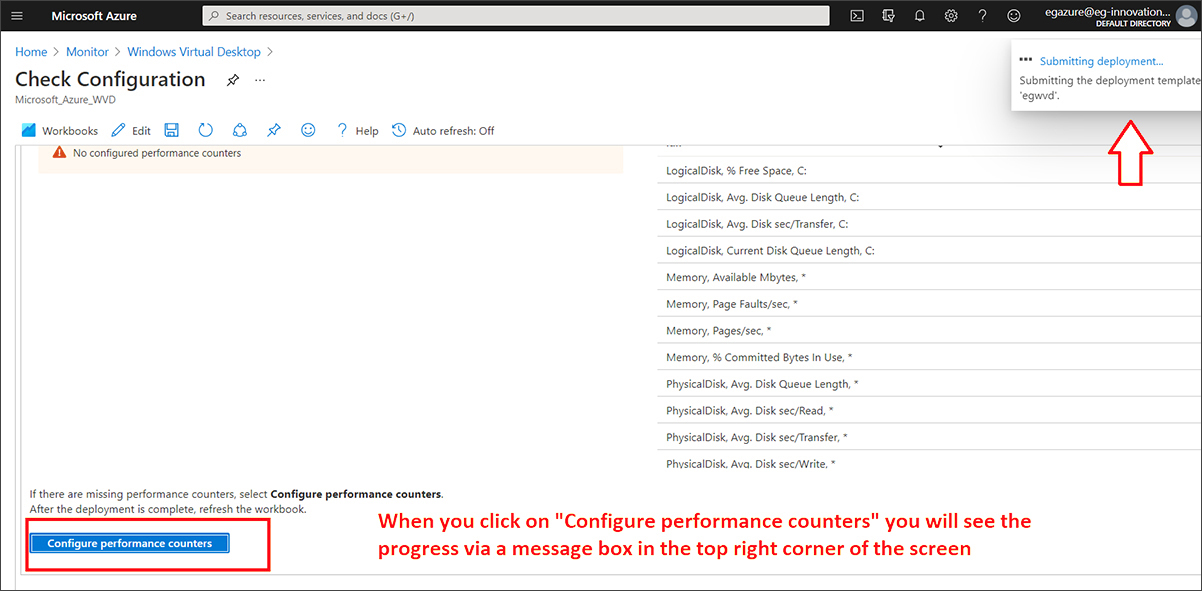
Returning to the configuration check, if this is the first AVD host pool you have added to Azure Monitor you will need to you will need to add the performance counters and events first.
If you have previously monitored AVD host pools in Azure Monitor you should be aware that Microsoft changed the default set of metrics collected to reduce costs by removing some metrics, particularly some per process metrics. If you haven’t already, you will probably want to take action to implement these revised recommendations. See Microsoft blog post for instructions.
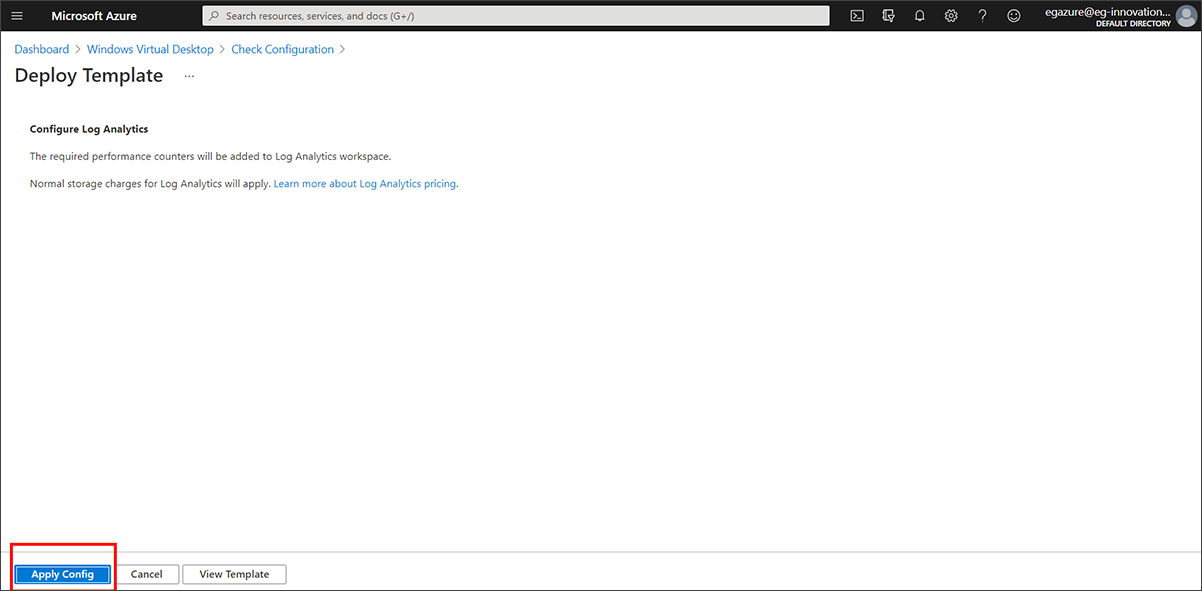
If you are starting afresh, click Configure performance counters.
Then click Apply Config
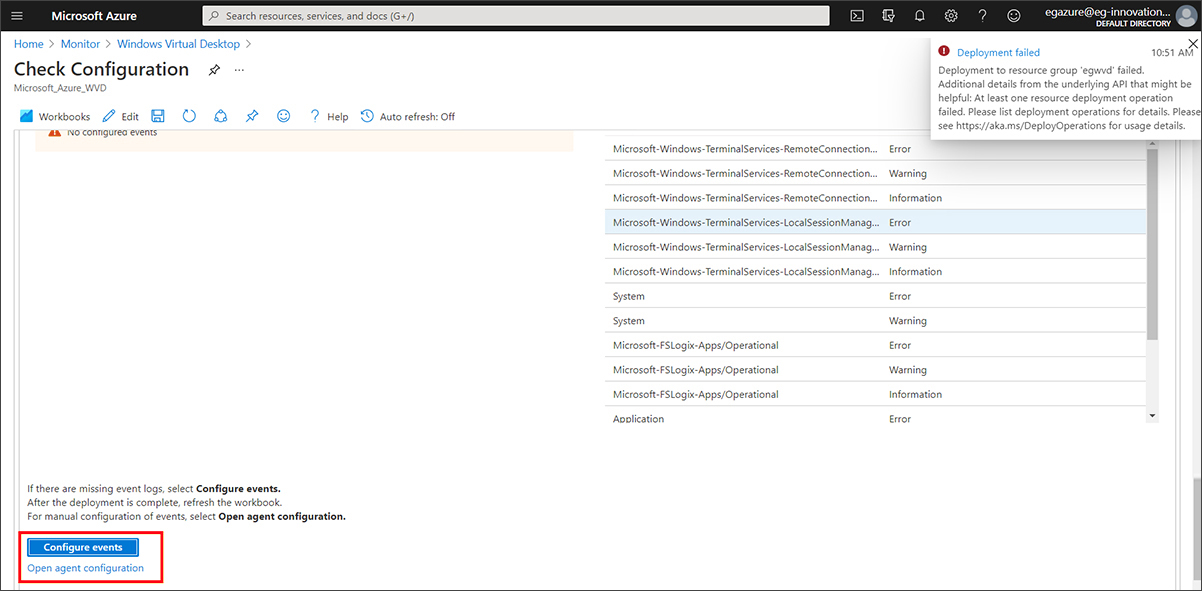
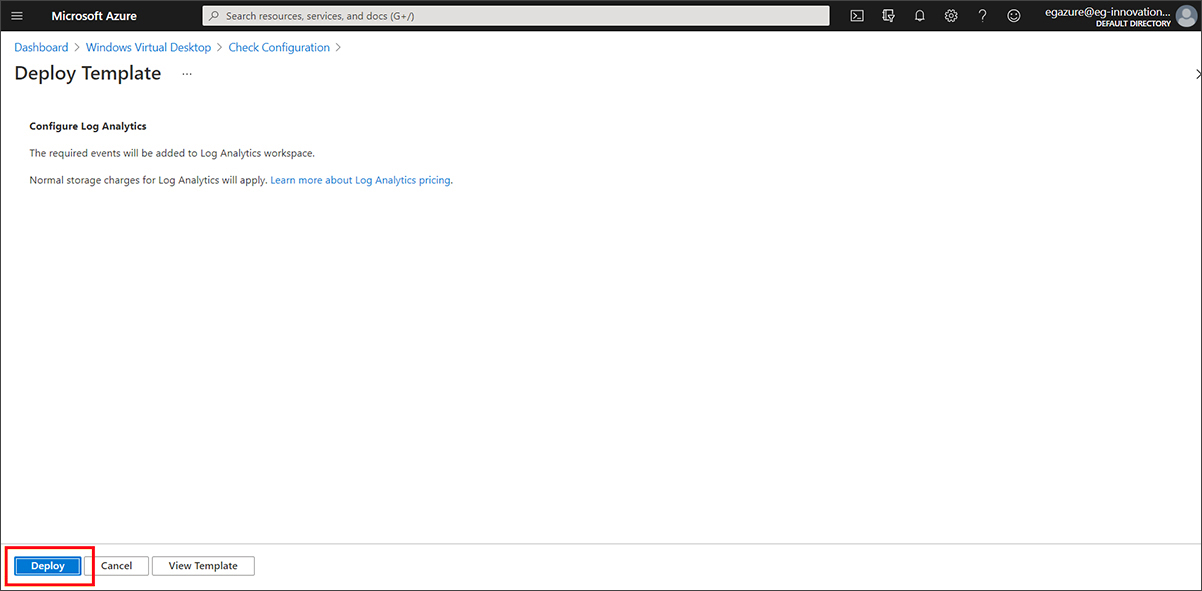
Next do the same for the events. Click on Configure Events and then Deploy
Now I was finally at the stage that Azure Monitor was enabled for my AVD Host pool. Returning to Monitor and the Insights hub, I explored the range of metrics available.
Note: In one of the above screenshots, you can see that after clicking deploy I was in fact returned to the main configuration check with a deployment failure, this happened several times whilst I was writing this guide and was always resolved by repeating the steps until it worked. I’m not sure what the issue was but it felt a bit flaky at times.
Now I was finally at the stage that Azure Monitor was enabled for my AVD Host pool. Returning to Monitor and the Insights hub, I explored the range of metrics available.
It is worth spending some time setting up some sessions to the VMs and disconnecting some etc, leaving applications open or running some load generation tools so that you don’t have a lot of completely empty metrics and graphs.
Next Steps
There are a number of things you may want to do now.
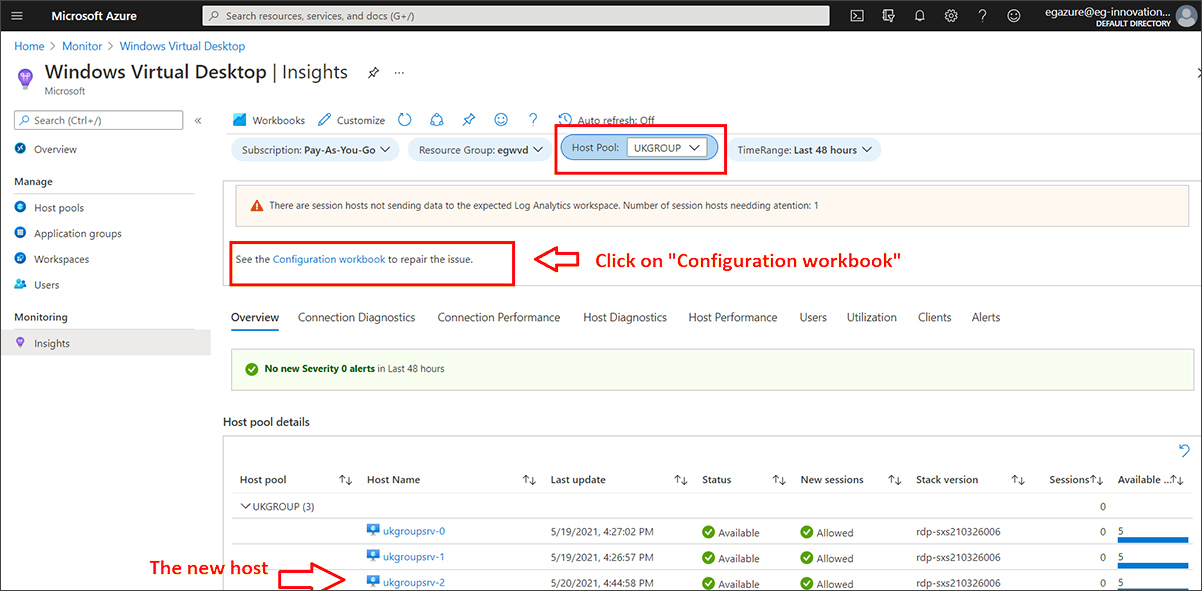
- Add additional AVD hosts to your pool: If you add additional hosts to your pool, you will need to add them to Azure Monitor too via the configuration workbook. I added a third host to my pool. Then navigated via the Monitor Icon on the portal home page, via Insights hub on the left-hand menu again and selecting the AVD monitoring option under “Others” again. Select the AVD host pool (in my case “UKGROUP”) and a warning message will advise you that some hosts in the pool are not being monitored. Click on the hyperlink to the “Configuration workbook”.
 Now switch to the “Session host data settings” tab, where the new host will be displayed and you can click Add hosts to add it to the monitored hosts. When I say “will be displayed” I found this process very unreliable, about 50% of the time when I switched to the “Session host data settings” tab, rather than the host being displayed I saw query failure messages, repeating switching between the tabs a few times usually resolved, it felt very much like time out errors or similar.
 - Enable in-guest agented monitoring within the VMs of a AVD pool to gain more data from within the inside view of the VMs (VM Insights):Before doing this, you may want to review what this will give you, although there is no additional charge for the service, you will pay for the data generated and ingested into Log Analytics.
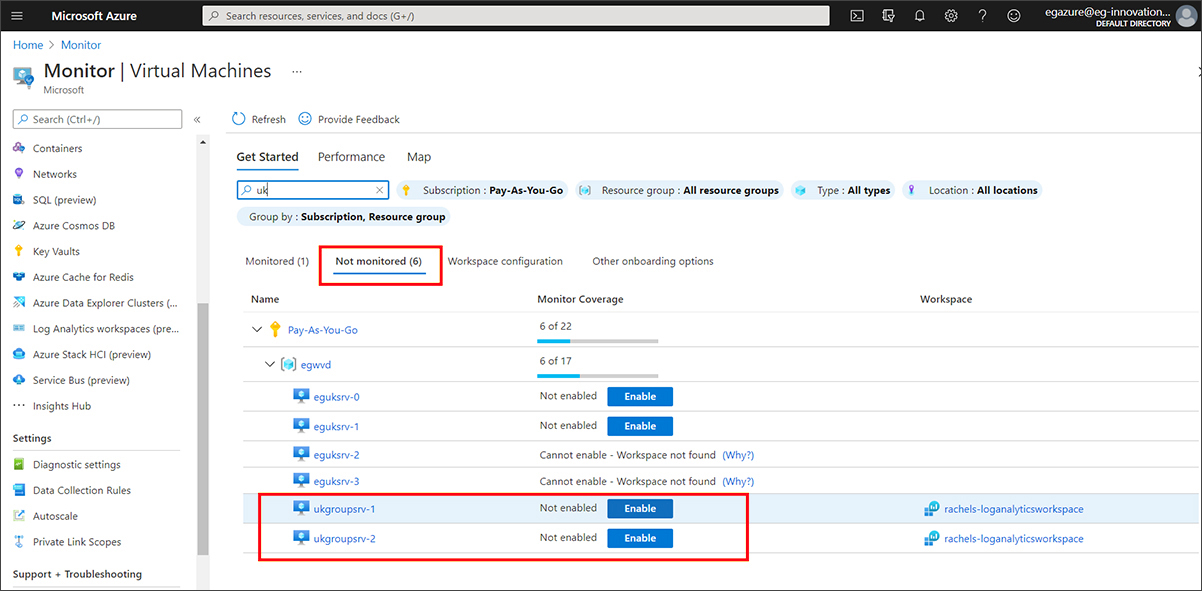
Navigating from the portal homepage via the Monitor icon to the Insights hub, you can set up agented VM monitoring by selecting Virtual Machines rather than AVD Host Pool as you did earlier.
You can use the search filter if you have a lot of VMs to find those in your AVD host pool and can see they are associated with the Log Analytics Workspace, then click Enable on those you wish to deploy VM Insights on.
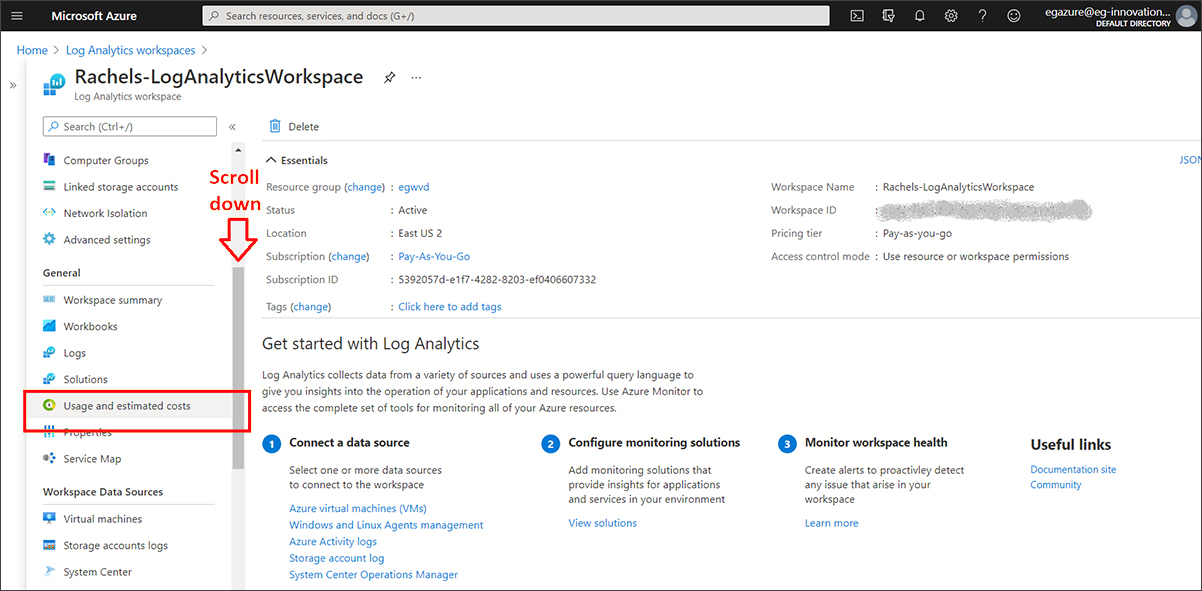
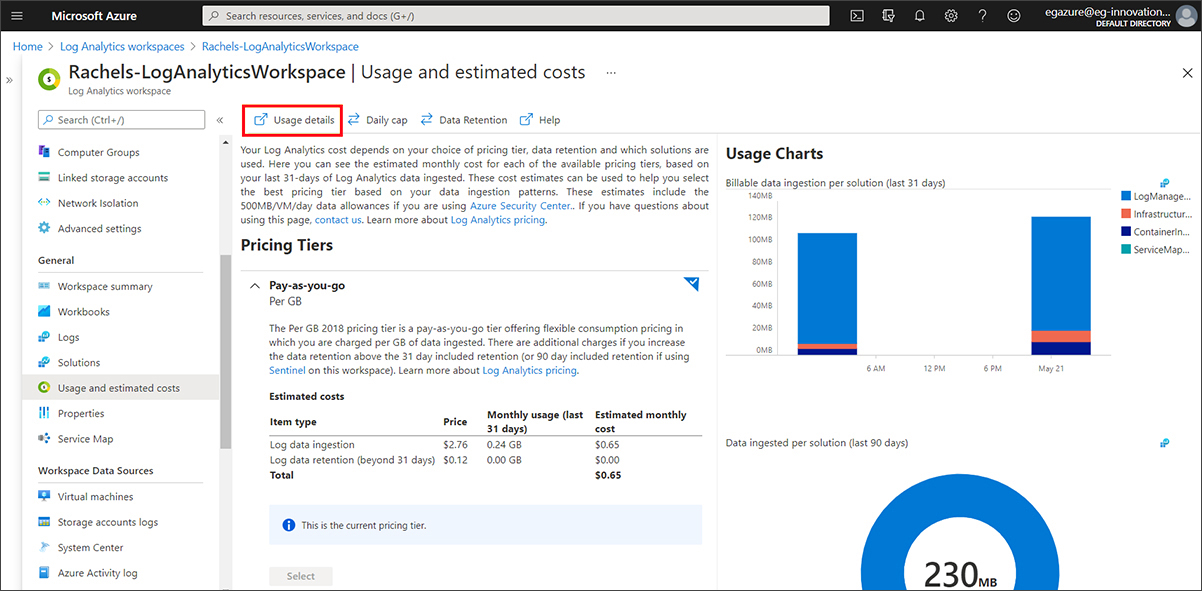
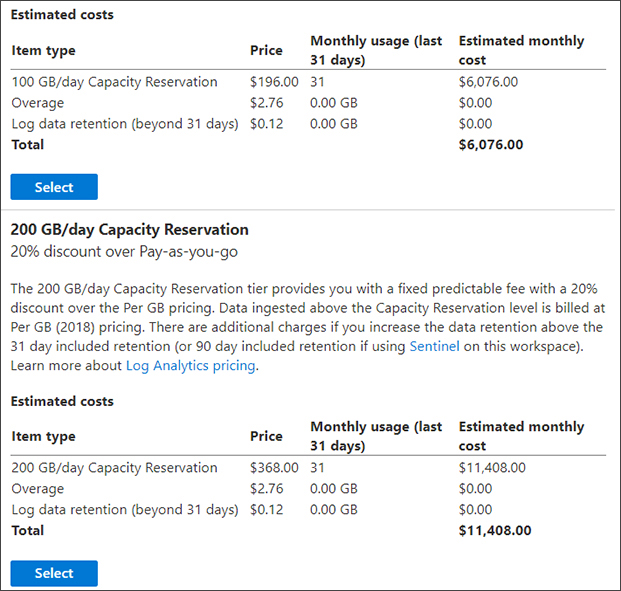
- Figure out how much it will cost From the portal homepage, you can select the Log Analytics Icon and navigate to you Log Analytics Workspace, on the left-hand menu, scroll down to find Usage and estimated costs.Here you will see the pricing per MB for ingesting data into your Log Analytics Workspace and the cost of retaining data beyond the default 30 days.Until you have left your setup for a while being used realistically it’s very hard to work out how many MB you will use, but at this point you might want to set a cap on costs using the Daily cap tab and if you want to adjust the time you retain data beyond the default included 31 days the Data Retention tab. If you intend to do long term trend analysis and capacity planning or have a seasonally varying business the data retention costs may be a significant proportion of your usage costs long-term, the maximum retention period is currently 730 days.Scrolling down on the Usage details tab, you can find the bulk data discountsMy eventual goal is to figure out how much using Azure for Monitoring and Alerting will cost and how much effort/resource it will take to setup compared to an out-of-the-box product. In the next installment I’ll be covering how to set up monitoring and alerting of WVD within Azure Monitoring, and I will warn you that in Azure alerts are PAYG too.
More Information
- Jim Moyle from Microsoft recently announced the availability of the “Enterprise-scale support for the Windows Virtual Desktop construction set“ which contains a good overview of “Enterprise-scale management and monitoring for Windows Virtual Desktop” .
- You can read more about Azure Monitoring Tools and Solutions from eG Enterprise

eG Enterprise is an Observability solution for Modern IT. Monitor digital workspaces,
web applications, SaaS services, cloud and containers from a single pane of glass.
 Rachel has worked as developer, product manager and marketing manager at Cloud, EUC, application and hardware vendors such as Citrix, IBM, NVIDIA and Siemens PLM. Rachel now works on technical content and engineering and partner liaison for eG Enterprise.

