Real User Monitoring
See exactly what users experience across web applications and pinpoint the root cause of slowness and errors in minutes. Diagnose issues across browser, network, server, and third-party services with correlated session replay and full-stack visibility.
Free TrialMonitoring
digital user experience
Every second of delay in your users’ experience (UX) can hurt your business, by impacting users, revenue, and trust. Studies show that even a 1 second slowdown can reduce conversions by 7% and increase bounce rates. As digital performance is directly tied to business outcomes, real-time insights into how users interact with your applications is no longer optional. To stay competitive, organizations need full visibility into user journeys, front-end performance, and third-party dependencies — before small delays escalate into costly production issues.
Traditional data center-centric views of IT performance do not provide the complete picture of actual user experience. While these can provide high-level uptime/downtime analytics, they lack actionable insights of real user experience and service slowdown, a critical need for IT managers to preemptively detect and resolve issues.
See exactly what your users are experiencing
Real User Monitoring (RUM) capabilities in eG Enterprise allow you to see exactly what every end-user is experiencing when accessing your web application.
- Monitor key user experience signals — Core Web Vitals (Largest Contentful Paint, Interaction to Next Paint, First Contentful Paint), Time to Interaction for dynamic applications, and Visual Completion to reflect when a page is truly usable — giving you a precise, user-centric view of application responsiveness.
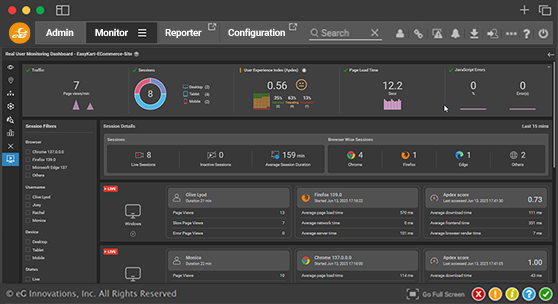
- Track every user session to pinpoint slow load times and JavaScript errors.
- Replay full user sessions and visualize real-world behavior, isolate issues, and validate fixes.

- Identify hidden bottlenecks caused by third-party scripts, ad networks, or analytics tags. Filter issues by device, location, or user ID, and accelerate root cause analysis through back-end trace correlation.
- Detect regressions post-deployment, correlate synthetic tests with RUM data, and track Core Web Vitals and other SLA metrics to validate performance before and after release.
Unified dashboard for
full-stack user experience visibility
Whether your business runs on custom web applications (Java, .NET, PHP, NodeJS, etc.) or on packaged web applications such as Microsoft Dynamics, SharePoint, Office 365, Confluence, SAP Fiori, or PeopleSoft, eG Enterprise helps you deliver a great user experience.
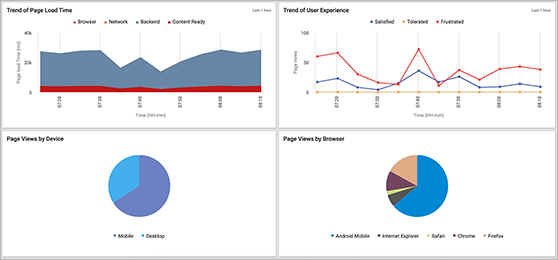
At a glance, view key performance indicators for each of your internal and external web applications, and track visits by device, browsers, and unique users. Visually monitor real-time end-user experience metrics by location (country, region, city) and pinpoint which locations are impacted by poor application performance — and drill down for further insights.
If you’re looking for a monitoring tool with APM (business transaction monitoring, real user monitoring), infrastructure and network monitoring capabilities and you want to get quick results, eG Enterprise is the right tool for you. In addition, you don’t need much human resources for the implementation and maintenance. ![]()
Features
Answer critical UX and DevOps questions
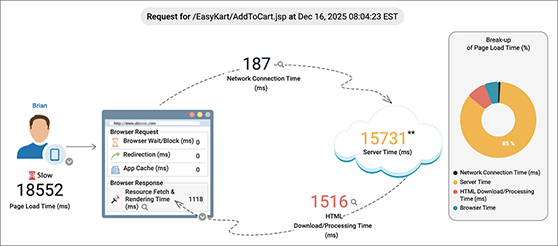
eG Enterprise dissects the processing time of web transactions and identifies what is causing slowdown.
Identify the root cause of UX issues through correlated application and infrastructure insights
When Real User Monitoring indicates slow server-side performance, IT teams need full-stack visibility to diagnose the root cause: whether it is ine icient code, backend slowness, infrastructure bottlenecks, or cloud latency. eG Enterprise connects the dots across user experience, application logic, and infrastructure in a single, correlated view.
Supported platforms
and technologies
| Web Applications | Supported Platforms & Technologies |
|---|---|
| Packaged Applications | Microsoft Dynamics, Microsoft SharePoint, Microsoft Office 365, Atlassian Confluence, SAP Fiori, Oracle PeopleSoft |
| Custom Applications | Java, .NET, Ruby on Rails, Python Django, CakePHP, Drupal |
Frequently Asked Questions (FAQs) about Real User Monitoring
Real User Monitoring in eG Enterprise captures real browser-side performance signals such as Core Web Vitals, JavaScript errors, session timings, and third-party delays, then correlates them with backend, network, and infrastructure metrics to identify root cause.
Yes. eG Enterprise RUM is framework-agnostic and works with any browser-based application, including Angular, React, Vue.js, Svelte, Ember, Backbone.js, and custom JavaScript applications.
By identifying real-user delays, errors, and abandonment patterns in real time, eG Enterprise helps teams fix performance issues that directly impact conversions, bounce rates, and customer satisfaction.
No. eG Enterprise uses predictable, fixed pricing that is independent of ingestion volume, allowing teams to collect full-fidelity RUM data without cost spikes during traffic surges or incidents.
Yes. eG Enterprise RUM isolates latency and errors caused by third-party services such as analytics tools, ad networks, CDNs, and embedded widgets, showing their direct impact on user experience.
Session replay allows teams to visually reconstruct real user journeys, validate reported issues, and confirm fixes by observing exactly how users experienced delays, errors, or broken interactions.
No. eG Enterprise Session Replay records real user sessions in production and visually replays exact user experiences as they actually occurred. It captures real clicks, scrolls, delays, errors, devices, browsers, and network conditions, and correlates them with backend performance data. It does not simulate user behavior or run scripted tests—session replay shows evidence from real users, not assumptions.
Session replay captures and replays actual user interactions in production, showing real behavior, real devices, real networks, and real errors. Synthetic tests and web simulations use scripted paths and controlled conditions, which are useful for baseline checks but cannot reveal unpredictable user actions or real-world performance issues.
eG Enterprise automatically correlates RUM data with application traces, infrastructure metrics, and network latency to pinpoint whether issues originate in code, databases, containers, cloud services, or networks.
Synthetic monitoring tests predefined paths under controlled conditions, while RUM captures actual user behavior and performance across devices, locations, and real-world network conditions.
Yes. eG Enterprise supports SaaS, on-premises, and hybrid deployments, enabling consistent RUM visibility across cloud-hosted, on-prem, and enterprise web applications.
eG Enterprise RUM is designed for application teams, DevOps, SREs, and IT managers who need end-to-end visibility into real user experience across modern web apps, packaged enterprise platforms, and complex hybrid environments.


