Get total visibility into VMware server performance. Monitor hypervisor resources, storage LUNs, VM clusters, VMs, vMotions and applications from one console. Only VMware monitoring tool to provide correlated inside and outside views of VMs, with one license.
Free TrialTrusted by leading companies


VMware performance monitoring is essential for ensuring the availability and security of virtualized environments. By continuously tracking resource usage, VM performance, and potential issues, businesses can prevent downtime, optimize resource allocation, and maintain a stable virtual infrastructure.


Go beyond traditional VMware vSphere Monitoring Tools with end-to-end visibility across heterogeneous infrastructures and comprehensive operating system metrics from every VM guest.

Go beyond VMware Monitoring with VMware vROps with end-to-end monitoring of heterogeneous infrastructures and visibility of OS metrics from every VM guest.


VMware vSphere -- formerly known as VMware Infrastructure -- is the brand name for VMware's suite of server virtualization products that includes its ESXi hypervisor and vCenter management software.
eG Innovations is a VMware Technology Alliance Partner and our flagship monitoring solution,
eG Enterprise is certified VMware Ready and Partner Ready for VMware Cloud on AWS.


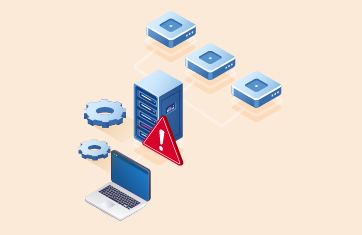
VMware monitoring tracks the availability, performance and usage of different components of a VMware vSphere infrastructure. It includes monitoring of all key areas of a VMware ESXi hypervisor including the hardware sensors, CPU utilization, free memory, zero memory, balloon memory and memory over-commitment, status of the storage LUNs used and the storage adapters and latency for reads and writes, and the status and utilization of network interfaces. Monitoring of individual VMs is also a key part of VMware monitoring. IT admins need to see utilization and status for each VM and they need to know when a VM is added/removed from a VMware vSphere server.
VMware vCenter plays a very important role in a VMware infrastructure. Datastores are associated to vCenters and then mapped to different ESXi servers. These datastores need to be monitored. Virtual Machine clusters are also handled by vCenter. Using DRS and live migration, vCenter coordinates the movement of VMs between hypervisors. vCenter is also the central point of alerting on VMware KPIs. Monitoring of VMware cluster, user sessions, DRS activity, orphaned VMs, old snapshots, etc. can be performed by connecting to vCenter. Hence, monitoring of vCenter status and performance is important.
VMware monitoring by eG Enterprise is agentless. A remote agent connects to vCenter or to an ESXi server and uses the VMware SDK/API to collect performance metrics and report them in the eG Enterprise console.
One of eG Enterprise's unique capabilities is its 360-degree view of VM performance. Using VMware APIs, eG Enterprise collects information about the physical resources used by individual VMs. To provide further insight, eG Enterprise provides light-weight VM agents that can be deployed on VMs. By connecting to the VM agents, eG Enterprise also obtains an inside view that depicts what application(s) inside a VM is taking up resources.
The use of a single license to monitor a VMware hypervisor and all its VMs (inside and outside perspectives) is a key differentiator of eG Enterprise.
Also, eG Enterprise monitors multiple types of hypervisors including Microsoft Hyper-V, XenServer, Nutanix AHV and others from a single console, unlike VMware vROps.
eG Enterprise's ability to monitor applications in-depth and to correlate application performance with that of the underlying virtual infrastructure is another unique feature.
eG Enterprise's VMware monitoring is licensed by hypervisor, not by cores, sockets or number of VMs. And its licenses are transportable across hypervisor technologies.