Get deep visibility into the status and performance of your virtual desktop services and quickly get to the root-cause of slow logons, lag, slow applications, and network issues with eG Enterprise which provides true end-to-end and top to bottom monitoring.
Free TrialTrusted by leading companies


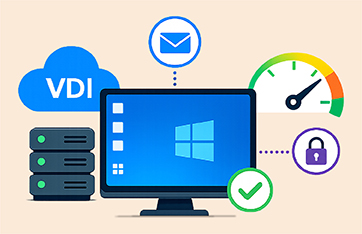
eG Enterprise is an end-to-end VDI performance monitoring solution that delivers single-pane-of-glass visibility into everything VDI — desktops, hypervisor, network, storage, and more. Whether you are pursuing a new VDI deployment or an upgrade project, eG Enterprise is your go-to tool for VDI performance assessment, user experience management, and resource optimization for all virtual desktop technologies - Citrix, Omnissa Horizon and Microsoft Azure Virtual Desktops.
Explore monitoring for:
A VDI monitor provides comprehensive visibility into your virtual desktop infrastructure, allowing you to:


eG Enterprise is an end-to-end monitoring software that provides incredible in-depth insight into all aspects of user's experience when accessing virtual desktops. With eG Enterprise, VDI assessment is made easy as you can:


With eG Enterprise, we know that we can address every single monitoring or performance management issue that a customer environment may have around their digital workspace, that’s a
powerful capability.![]()


Monitor virtual desktops as a service and not as individual silos: Get correlated visibility of the status of the entire VDI environment from a single pane of glass.

Improve user experience and business productivity: Proactively monitor, diagnose and troubleshoot VDI performance bottlenecks.

Right-size and optimize the virtual desktop infrastructure: Use predictive analytics to forecast resource depletion and plan capacity expansion.

Citrix Virtual Desktop | Omnissa Horizon

Citrix Ready and VMware Ready certified monitoring solution