Applications and Infrastructure Monitoring for AWS Services from a Single Pane of Glass.
Full-stack observability for cloud-native and hybrid IT services ensures it's business as usual on AWS cloud
Trusted by leading companies


Don’t struggle with multiple consoles for application and infrastructure and then spend hours correlating across consoles.
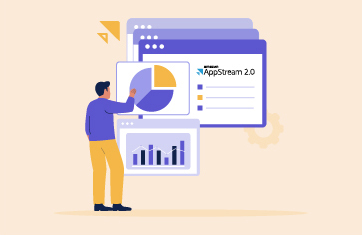
Use our industry-first truly converged application performance monitoring and infrastructure monitoring solution. Get unparalleled Amazon monitoring across user experience, business transactions, applications, and the supporting AWS services and infrastructure – all from a single console.
Watch our webinar to learn how AWS monitoring software can help answer the question “why is my application slow?”
Watch Webinar

Native monitoring with AWS CloudWatch basic and extended capabilities is cumbersome to set-up. Cost control can be a challenge as every metric costs money, and set-up can take a lot of effort as well.
eG Enterprise makes AWS application monitoring and cloud infrastructure simple. Pre-defined templates make it easy to set up monitoring and alerting. Licensed by OS instance, AWS account, and by SaaS application, eG Enterprise addresses the key challenges cloud administrators have with native tools
Go beyond native AWS (Amazon Web Services) monitoring tools:
Applications are the heart of your business. If an application goes down, it leads to loss of reputation and thousands of dollars of revenue. With eG Enterprise, you get visibility into every layer, every tier of the cloud infrastructure supporting your cloud services.
Additionally, with AWS Server Monitoring, enterprises can ensure optimal performance and availability of their cloud infrastructure by continuously tracking the health and performance metrics of their AWS servers.

Cloud infrastructures have unique requirements compared to on-premises deployments. eG Enterprise is a cloud-ready performance monitoring solution.
 |
Auto-discover instances, volumes, databases, applications, and other AWS services being used |
 |
Start AWS Monitoring in minutes with no manual intervention |
 |
Out-of-the-box monitoring and analytics for most popular AWS services |
 |
Pre-built AWS app monitoring dashboards to track key performance indicators for all application tiers and cloud services |
 |
Auto-baseline your infrastructure and get alerted about excessive usage patterns or anomalies |
Supports dynamic microservices and container environments


Consume as software you install and operate as SaaS.
AWS well-architected and certified, our SaaS deployment is lightweight and easy. Get started in minutes.
Easy subscription pricing. Available from AWS marketplace.


Large supermarket chain automates AWS cloud infrastructure monitoring with eG Enterprise.

Leading Cloud and Workspace Managed service provider offers automated AWS monitoring service with eG Enterprise.
Users get frustrated and productivity drops when their desktops and applications run slow. We had searched a long time for a tool that would give us visibility into individual Citrix user sessions, including application-specific details. Finally, we found what we needed in eG Enterprise.![]()

eG Enterprise gives us the opportunity to be proactive. It makes sure that we have a grip on our IT infrastructure to ensure the best possible IT environment for our end users. When issues occur, we get accurate and actionable insights on how to solve those issues fast without the need to spend extra effort, money, and time on hiring the right consultants for this!![]()
The ROI of eG Innovations exceeded our expectations. Not only did we get those chargebacks reduced, we also benefitted IT as a whole because help desk tickets weren't created and time management was a lot better-- we weren't spending hours trying to pinpoint issues, we could reallocate those resources to other, more important activities.![]()

Infrastructure and application monitoring for AWS focuses on tracking the health of all the key IT services hosted on AWS Cloud. Detection and alerting of problems, root-cause diagnosis, reports and analytics are also included in AWS monitoring tools.
Yes, the cloud service provider does monitor the health of the key infrastructure they use for delivering their cloud services. But problems you may face on AWS could be unique to your EC2 instance, or your database instance. The cloud service provider SLAs are only around uptime of their service, not around performance, and will not help you diagnose problems with applications you have hosted on AWS. You may find our whitepaper on 6 myths of cloud performance monitoring to be of interest.
No. AWS and other cloud environments have unique characteristics. The services they offer are different from traditional on-prem environments (e.g., AWS S3, AWS CloudFront, AWS WAF are all unique cloud services).
The type of challenges and problems you will face when using AWS cloud are different from on-prem infrastructures (e.g., you need to know if your AWS EC2 instance has sufficient CPU credits). Hence, a tool designed for an on-prem infrastructure cannot be directly used to monitor AWS resources and services.
AWS CloudWatch can be used to monitor many of the AWS services. It can also be used to monitor KPIs from within AWS EC2 instances. But set up of CloudWatch can be time-consuming and cumbersome. Furthermore, there is a cost per metric, which makes it difficult to predict monitoring costs. You may find our survey on cloud performance monitoring trends to be interesting. Here, you can see some of the challenges AWS customers have with AWS CloudWatch.
The best AWS cloud monitoring tool depends on your requirements. If your entire tech stack uses AWS services only, and if you do not want to use 3rd party tools, AWS CloudWatch is the best tool for you. If you want to monitor a multi-cloud or hybrid cloud deployment, or if you need in-depth monitoring of applications deployed on AWS, a converged application and infrastructure monitoring tool like eG Enterprise is more suitable.
The effectiveness of IT applications is measured by user experience, and that is what you should focus on. Use synthetic and real user monitoring capabilities in an APM tool like eG Enterprise for this. Monitoring resources like CPU, memory and storage is important but not sufficient for ensuring good application performance on AWS cloud.
eG Enterprise is a total performance monitoring solution for AWS customers. Integrated tightly with AWS CloudWatch, eG Enterprise reports on the status, availability, and usage of all key AWS services. It also includes synthetic monitoring to assess application performance. Agents deployed on AWS EC2 instances can provide deep insight into application performance on these instances. Containers, database services, serverless technologies and digital workspaces are also monitored using eG Enterprise. Monitoring capabilities in eG Enterprise are well defined and deployment of the solution is very easy. Furthermore, the monitoring tool does not use per-metric licensing which makes it very economical.
There are dozens of metrics that you should be monitoring such as CPUCreditBalance, DiskReadOps, NetworkPacketsIn, and StatusCheckFailed. A more comprehensive list can be found in our blog post about important AWS metrics to monitor.
Yes, if you want detailed monitoring of AWS EC2 instances and especially if you need in-depth monitoring of application performance, then you will need to deploy agents on your AWS EC2 instances.