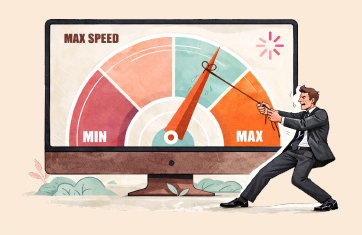
Boost business productivity on SAP, SharePoint, Office 365, and other enterprise applications
Free TrialTrusted by leading companies


Enterprise applications like SAP, Siebel, and PeopleSoft are business critical. Slow or poor performance of these applications can result in revenue loss for businesses, unhappy users, and lost productivity.
eG Enterprise Universal Insight helps operations teams assure the performance of enterprise applications. By monitoring, analyzing, and correlating the performance of every tier that supports the application, it helps organizations proactively detect and fix issues. Empirical data helps architects optimize and right-size their applications for maximal performance and utilization.
Modern enterprise applications frequently adopt multi-tier architectures to achieve scalability and performance. These architectures distribute functionalities across distinct tiers, including presentation, application logic, and data storage. While this approach offers clear benefits, it also presents complexities in business application monitoring and diagnosis.
Businesses encounter several key challenges associated with multi-tier deployments and their implications on application management.
1. Complex Business Application Monitoring:

2. Challenges with Virtualization:
3. Expertise Gap:
With eG Enterprise, we can now quickly identify root causes of incidents, resolving them before users are impacted. Automatic prioritization and categorization of alerts helps us better focus on the important issues and prioritize our resources accordingly.![]()

eG Enterprise offers a suite of cutting-edge features designed to streamline operations, enhance productivity, and drive innovation. The eG Enterprise solution encompasses advanced analytics, scalable infrastructure, customizable workflows, and robust security.
Dive in and explore the possibilities as we delve deeper into each feature, explaining its benefits and demonstrating how to leverage its power effectively.


No. eG Enterprise features a user-friendly interface, pre-configured dashboards for common applications, and seamless integration capabilities.
eG Enterprise offers flexible pricing plans tailored to suit businesses of all sizes. Furthermore, the long-term cost savings associated with improved application performance far outweigh the initial investment.
eG Enterprise distinguishes itself by delivering a comprehensive approach to business application monitoring and management. Unlike traditional solutions that concentrate on individual components, eG Enterprise delivers end-to-end visibility across hybrid IT environments. This includes actionable insights, automated diagnosis, and predictive analytics to optimize performance, ensure uptime, and enhance the user experience.