


Why Internet Speed Monitoring is Critical for IT Performance
Recent enhancements to eG Enterprise have added functionality to allow you to proactively test your internet speed with synthetic monitoring (“robot” tests that simulate real user activity).
Using the new functionality you can proactively monitor internet speeds 24×7 from any location.
The performance and quality of an Internet connection plays a major role in any IT environment. Use cases for this new functionality include:
- Troubleshooting when internet speed from a branch office is low, when users are experiencing slowness during access and content downloads.
- Assessing whether internet speeds vary over time, and whether you are actually getting the speeds promised by your ISP.
- For organizations relying on Microsoft 365, other SaaS services and cloud services, the quality of their internet connection has become even more important than before for ensuring acceptable user experience.
Internet Speed Testing with Ookla Integration
eG Enterprise now integrates with the Ookla Speedtest – the global broadband speed test. Ookla Speedtest is a free tool that measures the quality and performance of an Internet connection.
Speedtest measures the speed between a device and a test server using the device’s internet connection. It performs tests over a custom protocol over TCP sockets.
Speed tests measure your current connection’s maximum speed – how fast your device can upload and download information – by accessing nearby test servers.
eG Enterprise integrates with the Ookla Speedtest CLI (Command Line Interface) for monitoring Internet Connection speed repeatedly and automatically at a frequency that can be configured.
Figure 1 shows the layer view in eG Enterprise of the results of the Speedtest tests. Key metrics that are monitored include:
- Latency of network ping
- Jitter of network ping
- Packet loss of network ping
- Download speed
- Download latency
- Download jitter
- Upload speed
- Upload latency
- Upload jitter
What is Network Jitter & Why It Matters
Jitter is the variation in how long data packets take to travel across a network connection. Instead of arriving at consistent intervals, packets may come early or late, creating timing instability. High jitter can cause noticeable problems in real-time applications such as video calls, voice over IP, and online gaming, where smooth, evenly timed data delivery is essential. Common causes include network congestion, Wi-Fi interference, overloaded routers, or unstable internet connections.
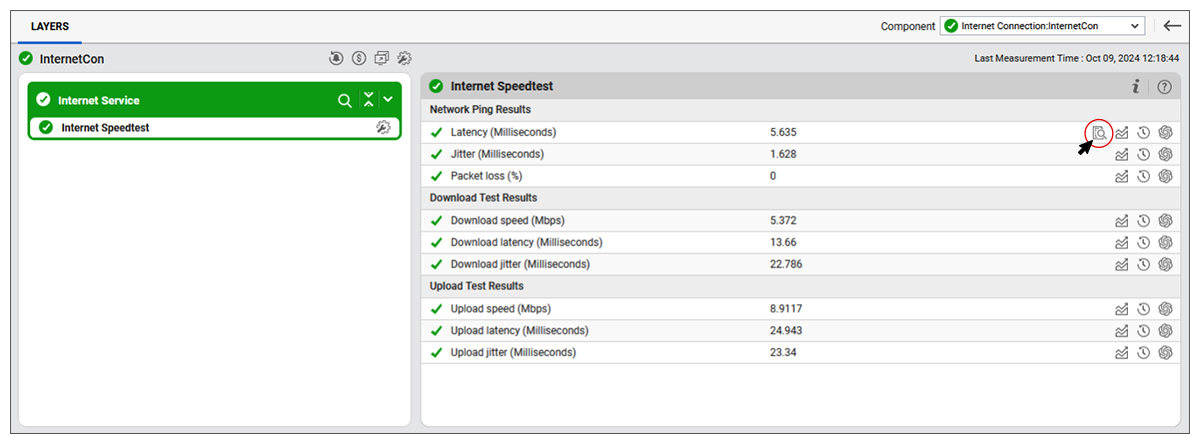
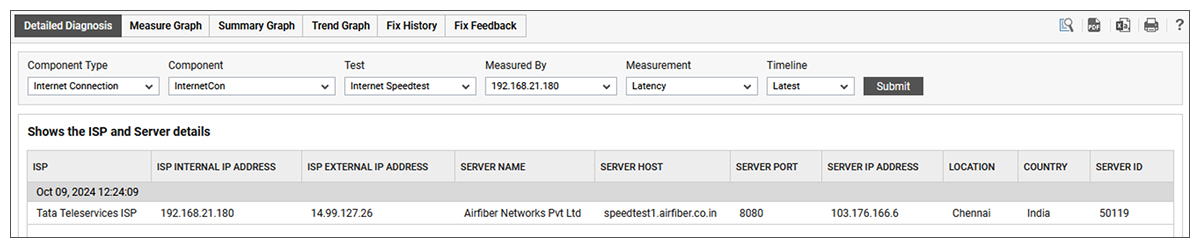
From the layer model shown in Figure 1, IT teams can use the detailed diagnostics icon to drill down into details of the test including the ISP and test server data (as shown in Figure 2).
Download Speed Test: Monitoring Internet Performance
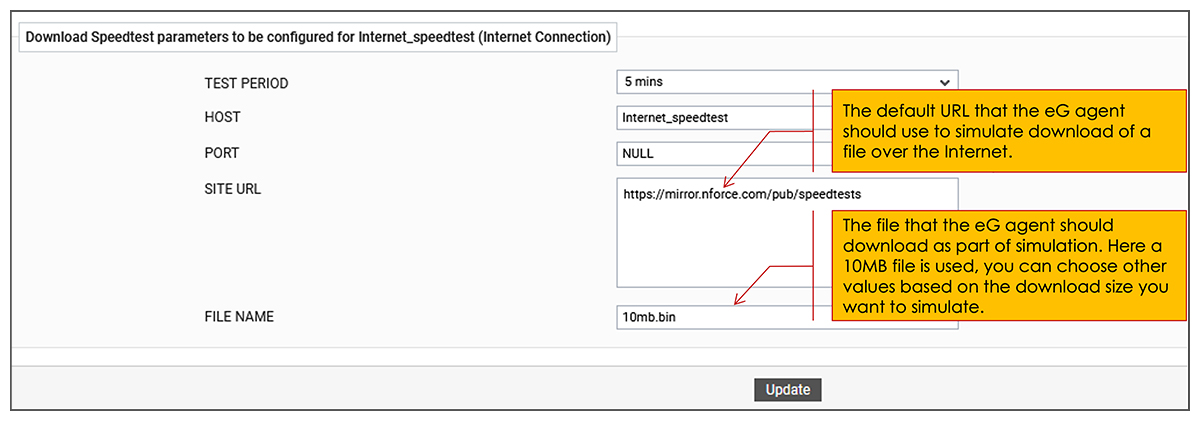
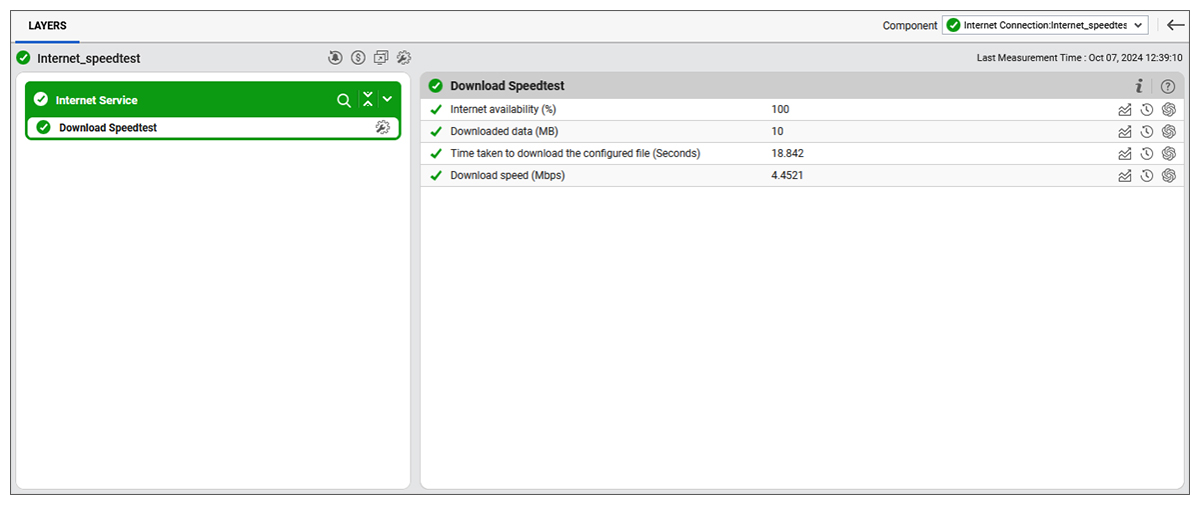
eG Enterprise also provides a basic default test to monitor internet connections – the “Download Speed Test”. This downloads a file from a pre-configured web site URL and measures connection availability and speed. The Download Speed Test can be executed by a Windows or Linux/Unix agent. It should be noted that this test does not depend on any 3rd party libraries but it does not provide results regarding Network ping/jitter and Upload speed. Figure 3 shows the simple configuration required for this test.
Once configured eG Enterprise will proactively test the download speed regularly and alert you to any performance issues affecting the internet connection (see Figure 4)
Download Speed Test vs Ookla Speedtest: Key Differences
eG Enterprise customers can choose to use both test or just one. The following comparison table is provided to help you make that choice.
| Download Speed Test | Ookla Internet Speedtest |
| Easy to set up; no 3rd party dependency | Requires CLI to be downloaded and installed on agent system. |
| Reports availability, download time and speed only. | Reports download speed, latency and jitter. Also reports these metrics using network ping. |
| Usually unmanaged and unknown | Usually fully managed, although BYOD may be found |
| Does not measure upload speed. | Reports upload speed, latency and jitter as well. |
| Requires no special ports to be used. The target server is selected during test configuration. | TCP port 8080 is used for communication. ICMP is used to discover the closest server. |
Using Speed Tests for Troubleshooting Network Issues
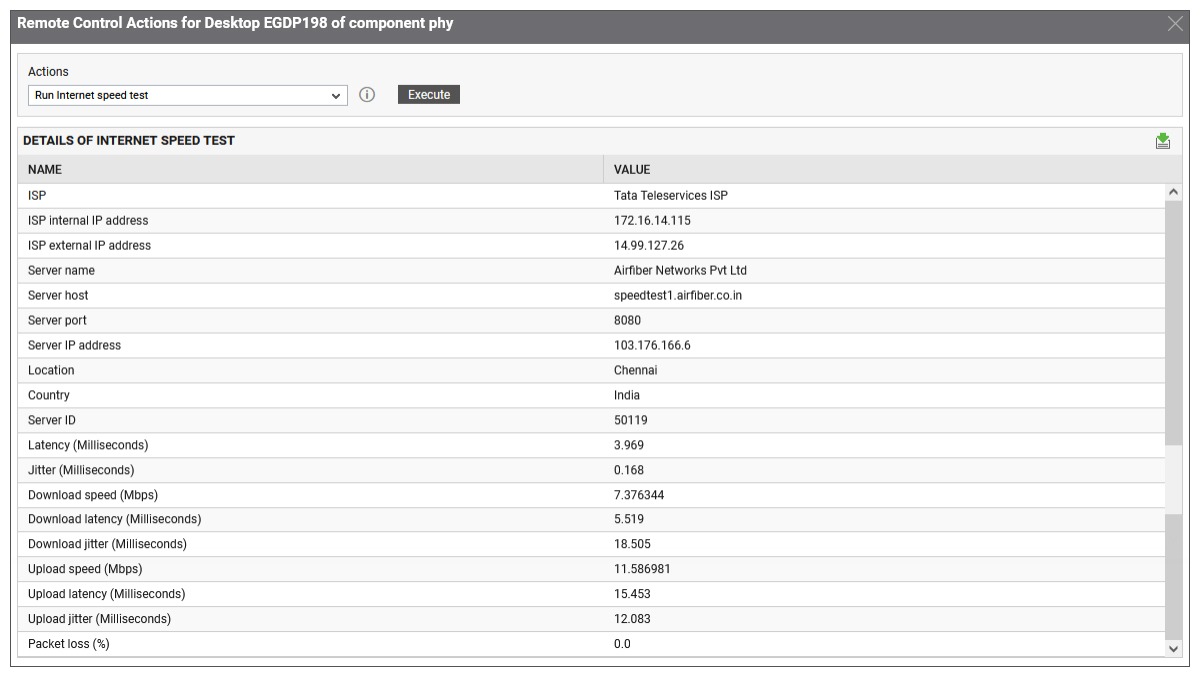
Both speed tests are supported as part of eG Enterprise’s Remote Control Actions. This means that an IT administrator or a helpdesk operator with appropriate privileges can run the tests as required to investigate internet performance on a remote system such as a user’s laptop endpoint. Figure 5 shows the results of the Ookla internet speed test reported by a VM agent running on a physical laptop.
Internet Speed Reporting & Performance Analytics
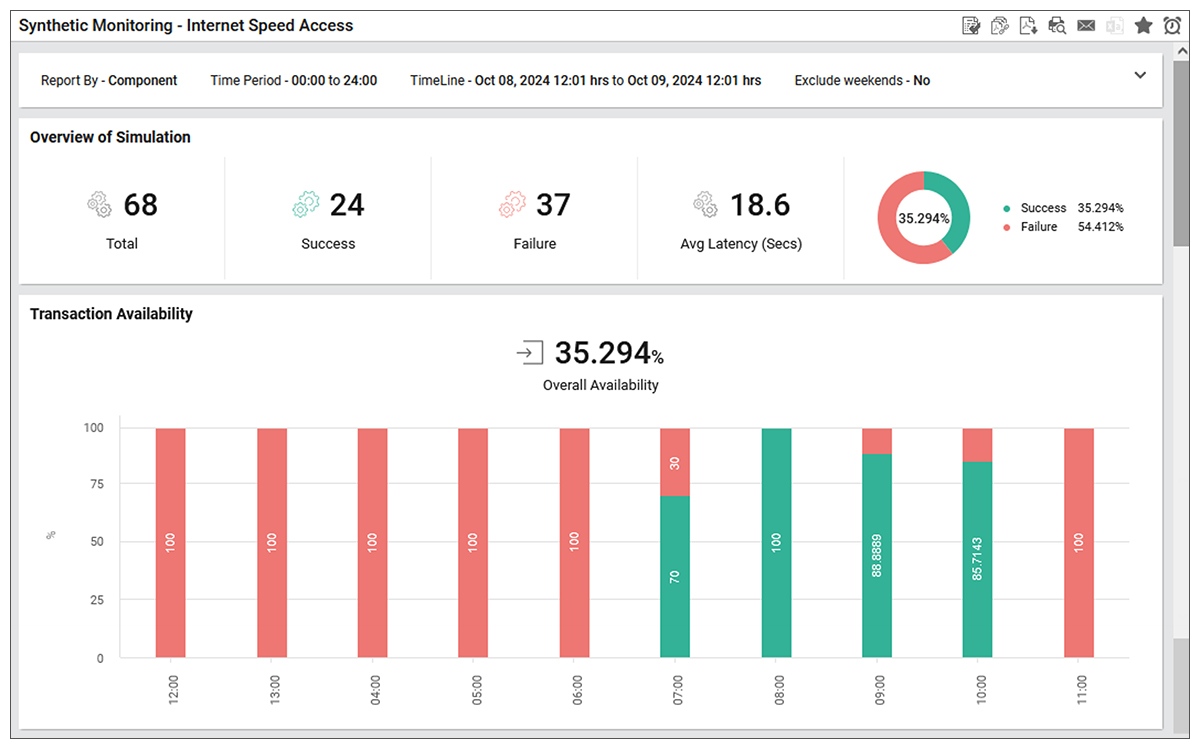
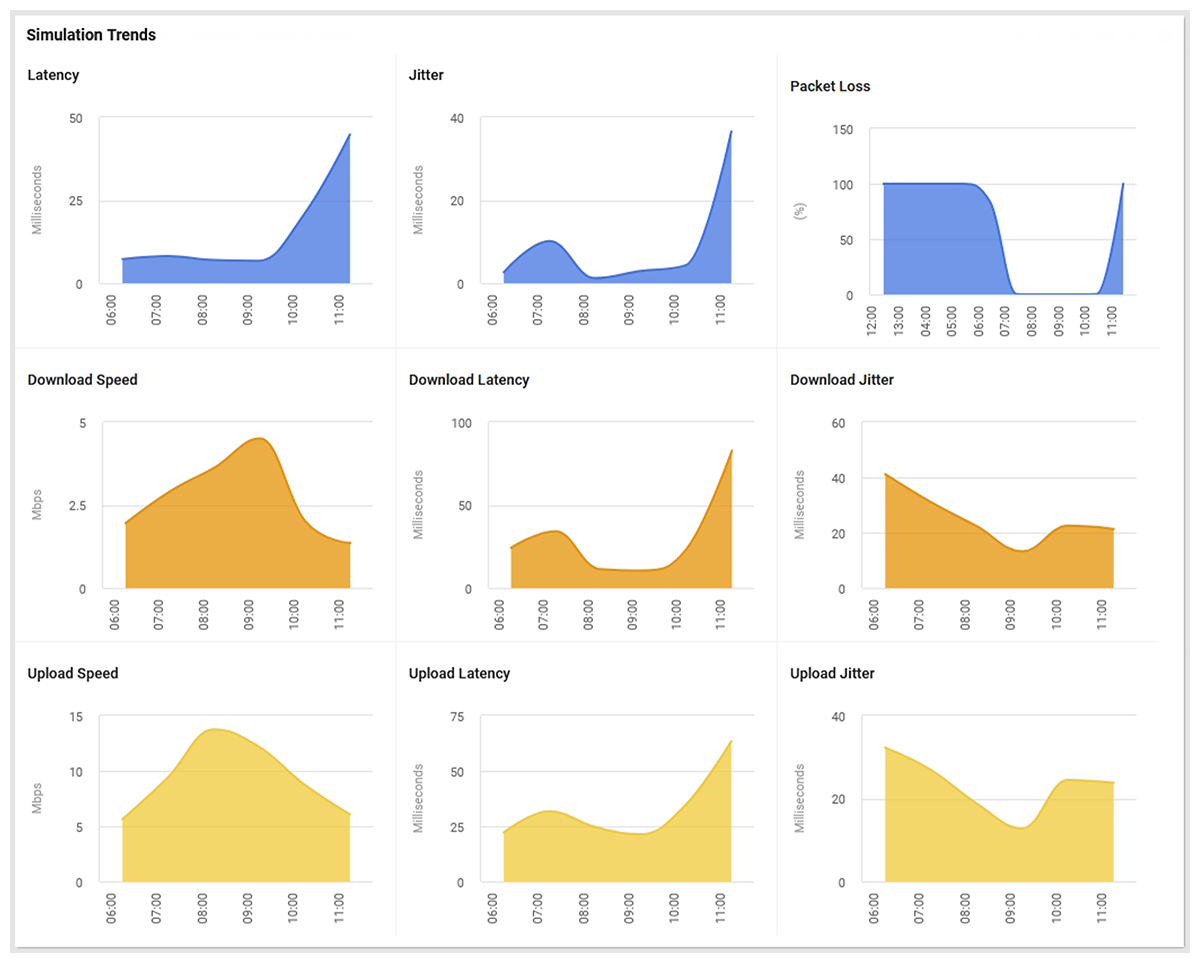
eG Enterprise now also includes built-in ready-to-go reports that allow IT administrators to overview internet speed performance over timescales of their choosing. These visually attractive reports mean that your internet speed monitoring can be used for management reporting as well as trend analysis and future planning. See Figures 6 & 7 for example reports.
Best Practices for Internet Speed Monitoring in Enterprises
Best Practices for Enterprise Internet Speed Monitoring include:
-
Monitor Continuously, Not Reactively
Run scheduled synthetic internet speed tests throughout the day instead of relying on user complaints. Continuous monitoring helps identify intermittent slowdowns, ISP congestion, and bandwidth degradation early.
-
Measure More Than Bandwidth
Track:
- Download/upload speed
- Latency
- Jitter
- Packet loss
Bandwidth alone does not reflect user experience.
-
Test from Multiple Locations
Monitor branch offices, datacenters, cloud regions, and remote-user locations separately. Performance issues are often geographic or ISP-specific.
-
Use Synthetic and Real User Monitoring Together
Combine active speed tests with real-user experience metrics to correlate network performance with application responsiveness.
-
Establish Baselines and Thresholds
Define normal performance ranges for each site and configure alerts for deviations, not just outages. AIOps-enabled solution such as eG Enterprise will automatically baseline internet speed and alerting is provided out-of-the-box.
-
Correlate Network Metrics with Infrastructure Data
Internet slowdowns may actually originate from:
- Firewall saturation
- WAN optimization devices
- DNS failures
- Packet-per-second limits
- VPN bottlenecks
Consider integrating your internet speed monitoring within a unified observability product that can determine the root-cause of internet issues rather than standalone tools that can only tell you that you have a problem.
-
Track Trends Over Time
Historical reporting helps identify recurring congestion patterns, ISP degradation, and capacity planning requirements.
-
Monitor Cloud and SaaS Connectivity Separately
Test connectivity to critical services such as Microsoft 365, Salesforce, Zoom
Internet speed to a generic server or cloud service may not reflect SaaS performance. -
Automate Alerting and Root Cause Analysis
Use monitoring platforms that correlate internet metrics with application and infrastructure telemetry to reduce troubleshooting time.
-
Validate ISP SLAs
Regular testing provides evidence when internet providers fail to meet contracted bandwidth or latency commitments.
Tools such as eG Enterprise Internet Speed Monitoring use synthetic testing and integrated analytics to proactively identify connectivity problems before they affect users.
Business Impact: User Experience, SaaS Performance & Productivity
Effective internet speed monitoring improves user experience by detecting latency, packet loss, and bandwidth issues before they disrupt work. It ensures consistent SaaS application performance, reduces downtime, accelerates troubleshooting, and supports employee productivity. Proactive monitoring also helps organizations validate ISP service levels and maintain reliable connectivity for remote and hybrid work environments.
Internet Speed Monitoring Metrics Explained
Internet speed monitoring goes beyond a one-time speed test by tracking latency, packet loss, bandwidth, and throughput over time. Synthetic monitoring is a common way to measure these metrics proactively and catch issues before users feel them.
What is latency?
Latency is the time it takes for data to travel from one point to another and back (or one way, depending on the measurement). Latency is typically measured in milliseconds (ms) and has a direct impact on responsiveness. High latency can make cloud apps, video calls, and SaaS tools feel slow even when bandwidth looks adequate.
What is packet loss?
Packet loss happens when packets fail to reach their destination, which can cause retransmissions, jitter, and degraded application performance. For enterprise networks, packet loss is especially important because even small losses can affect cloud applications and voice traffic.
What is bandwidth?
Bandwidth is the maximum capacity of a connection, not the actual speed users always experience. A link may have high bandwidth but still perform poorly if congestion, loss, or latency are present.
Difference between bandwidth and throughput
Bandwidth is the theoretical capacity of the link, while throughput is the amount of data actually delivered successfully. Throughput is usually lower than bandwidth because of protocol overhead, congestion, and retransmissions.
Which metric impacts user experience most?
There is no single winner, because user experience depends on the application type. For interactive apps, latency and packet loss often matter more than raw bandwidth, while large file transfers are more sensitive to throughput.
Common Causes of Slow Internet Performance
Slow internet performance usually comes from a mix of network, ISP, wireless, and application-path issues. Synthetic monitoring helps isolate whether the problem is local, last-mile, or cloud-related.
ISP congestion
ISPs can become congested during peak hours, which can increase latency and reduce throughput. Monitoring over time helps show whether slowness is tied to a specific provider or time window.
Network congestion
Internal congestion from oversubscribed links, poor routing, or overloaded devices can also reduce performance. Packet loss and rising round-trip time are useful indicators of congestion.
Wi-Fi interference
Wireless interference, weak signal strength, and crowded channels can all create inconsistent performance. This often shows up as intermittent latency spikes rather than a complete outage.
VPN bottlenecks
VPN tunnels can add encryption overhead and route traffic through longer paths, which increases latency and lowers throughput. Monitoring after VPN hops can reveal whether the VPN is the bottleneck.
Firewall limitations
Firewalls can create delays through inspection overhead, policy restrictions, or blocked probe traffic. AWS notes that synthetic probes may require firewall rules that allow the relevant source ports and protocols.
DNS issues
Slow DNS resolution can make applications feel sluggish before a connection is even established. This is why speed monitoring should include transaction timing, not only raw transfer speed.
Cloud connectivity problems
Performance problems can arise between users and cloud-hosted services even when local infrastructure looks normal. Cross-path monitoring and synthetic tests help identify whether the issue sits in the cloud route rather than at the endpoint.
How to Choose an Internet Speed Monitoring Tool
Choosing the right tool depends on whether you need one-time testing or continuous enterprise visibility. The best tools measure not just download speed, but also latency, jitter, packet loss, and performance trends over time.
Synthetic vs Real User Monitoring
Synthetic monitoring uses scripted tests to proactively check connectivity and performance before users notice problems. Real user monitoring shows actual user experience, so the strongest setup often combines both for complete visibility.
Automated alerting
Automated alerting helps teams respond quickly when latency, packet loss, or bandwidth issues cross thresholds. This is especially important for SaaS and cloud environments where performance can change quickly.
Historical reporting
Historical reporting makes it easier to identify recurring issues, peak-hour slowdowns, and ISP-related patterns. Trend data is more useful than a single speed result when you need to explain persistent performance issues.
Multi-location testing
Multi-location testing shows whether a problem is local, regional, or provider-specific. Testing from several locations also helps teams understand how performance changes across user regions.
SaaS monitoring capabilities
A strong tool should support monitoring for cloud apps and SaaS services such as Microsoft 365, Zoom, and similar platforms. This helps isolate whether the issue is with the internet path or with the application itself.
Root cause analysis
Root cause analysis features help connect speed drops to underlying causes such as DNS delays, VPN bottlenecks, congestion, or packet loss. Without this, teams may see symptoms but struggle to explain why they happened.
eG Enterprise is an Observability solution for Modern IT. Monitor digital workspaces,
web applications, SaaS services, cloud and containers from a single pane of glass.
Internet Speed Monitoring vs Traditional Speed Tests
| Traditional Speed Test | Enterprise Internet Speed Monitoring |
| Manual testing | Automated continuous testing |
| Single point-in-time result | Historical trend analysis |
| Measures speed only | Speed, latency, jitter & packet loss |
| No alerting | Automated alerts |
| Limited troubleshooting | Root cause correlation |
| Consumer-focused | Enterprise observability |
eG Enterprise is an Observability solution for Modern IT. Monitor digital workspaces,
web applications, SaaS services, cloud and containers from a single pane of glass.
Frequently Asked Questions
Synthetic internet speed monitoring uses automated tests to measure network performance continuously or on a schedule. It helps teams detect problems proactively instead of waiting for user complaints.
Manual speed tests provide a point-in-time snapshot, while synthetic tests run repeatedly and produce historical trends. Synthetic monitoring is better for enterprise use because it can reveal intermittent or recurring issues.
Packet loss can cause retransmissions, lag, call quality issues, and slow application response times. Even small levels of loss can affect critical business apps.
Monitoring over time creates evidence of actual performance against promised service levels. That makes it easier to confirm whether the ISP is meeting contractual expectations.
Bandwidth is the maximum capacity of the connection, while throughput is the actual data delivered. Throughput is usually lower because of congestion, overhead, or retransmissions.
Poor latency, jitter, or packet loss can make cloud apps feel slow even when bandwidth seems sufficient. This can affect syncing, calls, loading times, and general user productivity.
Yes, continuous synthetic monitoring is especially useful for intermittent issues because it captures patterns over time. Manual testing often misses these short-lived failures.
Enterprises should also track latency, jitter, packet loss, throughput, DNS response time, and route consistency. These metrics give a much more accurate picture of user experience.


