English
 Deutsch
 Espanol
 Français
 Portuguese
 中文
中文 한국어
한국어 日本語
日本語
Application Performance Monitoring (APM)
Application Performance Monitoring (APM) helps organizations monitor application performance, availability, response times, errors, transactions, and user experience. eG Enterprise provides end-to-end application performance monitoring with visibility across applications, infrastructure, user experience, and dependencies to help IT teams identify and resolve performance issues faster.

Trusted by leading companies


Monitor the Performance of Your Cloud, SaaS, and Business-Critical Solutions
In today's age of digital transformation and cloud-driven application deployments, delivering an excellent digital experience for end-user experience is the primary focus for organizations. Simply tracking application up/down status and basic CPU and memory utilization metrics is no longer sufficient. You need solutions that offer better observability and real-time insights to meet the growing demands of modern application monitoring.
A cohesive APM strategy that focuses on customers’ digital experience, business transactions, application dependencies and infrastructure performance is key to achieving application performance success.
Without unified visibility across these layers, IT teams are left reacting to isolated symptoms instead of solving the root cause. Gaps between application, transaction, and infrastructure monitoring create blind spots that delay resolution, frustrate users, and ultimately impact business outcomes. A cohesive APM approach ensures that organizations can proactively detect issues, prioritize based on user impact, and drive continuous performance improvements — delivering the reliability, speed, and responsiveness that today’s digital economy demands.
Application Performance Monitoring Use Cases
APM can help organizations monitor business-critical applications, web applications, cloud and hybrid applications, application transactions, databases, user experience, and application dependencies. It can also help teams detect performance degradation and troubleshoot issues before they significantly affect users.
How do you choose the right solution to monitor your application for your organization?
With so many APM tools on the market, it’s easy to feel overwhelmed. Each claim to offer full visibility, AI-powered insights, or end-to-end monitoring — but when it’s time to deploy, gaps emerge, integrations break, and teams are left juggling multiple tools. Choosing the right solution isn’t just about flashy features — it’s about confidence. Confidence that your monitoring platform will scale with your business, support your unique tech stack, and deliver value from day one. That’s where eG Enterprise stands apart.
eG Enterprise for
Application Performance Monitoring

By correlating user experience, application behavior, and infrastructure health in real time, eG Enterprise answers the critical question every organization faces: "Why is my application slow?" — and helps resolve it faster and more accurately than siloed monitoring tools.
With eG Enterprise, you can:
- Enhance digital user experiences.
- Accelerate application efficiency.
- Support faster, smoother production rollouts.
- Boost business productivity and IT efficiency.
Why are Organizations
Choosing eG Enterprise with Confidence?
Application and Infrastructure
Performance Monitoring
Application performance can be affected by databases, servers, networks, virtualization, storage, and other infrastructure components. eG Enterprise correlates application and infrastructure performance data to help teams distinguish the root cause from its symptoms.
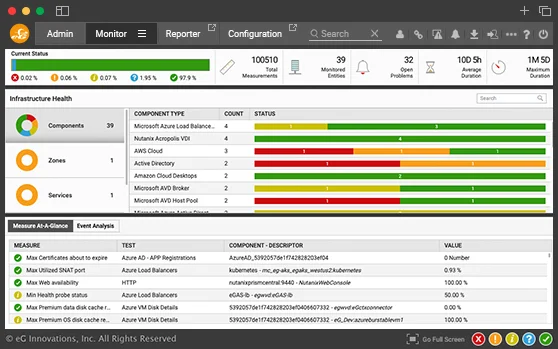
Problems in your application can happen anywhere in your technology stack. eG Enterprise offers a comprehensive view of APM performance, giving you a single-pane-of-glass that gets you to the root-cause of the problem in three clicks no matter where it occurs.
Application Topology Discovery and Dependency Mapping
Automatically discover applications and their dependencies across physical, virtual, cloud, and hybrid environments. Visualize relationships between applications, services, VMs, databases, networks, and infrastructure components to understand how dependencies affect application performance.

Considering application-to-application mappings, application-to-VM relationships, and application-to-network dependencies, eG Enterprise differentiates the root cause of a problem from its effects.
Unique among application monitoring tools, this unified monitoring capability helps administrators identify and resolve the exact cause of an application slowdown: Is it the application code, operating system, server hardware, database, network, virtualization, or storage?
Application Transaction Monitoring and Code-Level Diagnostics
Trace business transactions across application tiers to identify slow transactions, application errors, database queries, and remote service calls. Drill down from transaction performance to the application component or code-level issue responsible for the slowdown.

eG Enterprise uses a tag-and-follow approach and automatically traces user access from web browsers or native mobile applications to the application servers and pinpoints the server-side component responsible for slow business transactions.
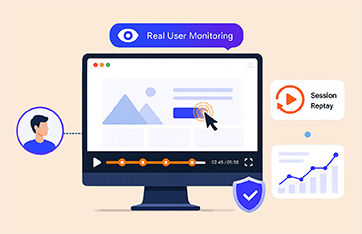
By combining real user behavior with synthetic simulation, eG Enterprise provides the full set of metrics and KPIs needed to proactively monitor, optimize, and protect the digital experience of your most important business services and applications.
Application Performance Diagnostics and Root-Cause Analysis
Move from application performance alerts to actionable diagnostics. Analyze application, server, database, and network performance, correlate alerts across tiers, and identify the underlying cause of performance degradation.


Application Performance Analytics and Reporting
Analyze application performance trends over time, compare performance before and after deployments or migrations, identify recurring issues, and use historical data for performance planning and optimization.
Leverage out-of-the-box and custom reports for streamlined historical application trending insights, operational analytics, and infrastructure capacity planning.

Enterprise application monitoring involves the continuous tracking and analysis of critical applications within an organization to ensure optimal performance, availability, and security. By monitoring key metrics such as response times, resource utilization, and transaction flows, businesses can proactively identify and resolve issues before they impact users.
Optimize Real User Experience with Actionable Metrics
eG Enterprise empowers you to deliver fast, seamless web experiences by tracking the real-world metrics that matter most.
Full Stack Application
Monitoring
with eG Enterprise
eG Enterprise, an application performance management solution, makes managing your applications easier than ever before. Our platform offers real-time monitoring and analytics, enabling IT teams to proactively manage system health and track user experience. Additionally, our comprehensive dashboards provide an integrated view of infrastructure performance, facilitating quick identification of complex problem areas and efficiently troubleshooting the issue. eG Enterprise streamlines critical processes for maintaining system security and monitoring operations so you can focus on what matters most: crafting the best experience for your users.
| Delivers deep performance visibility from application code to bare metal – across cloud, virtualized, containerized, physical, and hybrid IT infrastructures |
| Proactively detects and resolves slowdowns with AI – driven insights, machine learning, and automated root cause analysis |
| Brings user experience, application, and infrastructure monitoring into one console – reducing finger-pointing between IT, DevOps, and development teams |
eG Enterprise is Aligned with Gartner's Functional Dimensions of APM Platforms:
- Automated discovery and mapping of applications and infrastructure
- Observation of an application's complete HTTP/S transactional behavior
- Monitoring of applications running on mobile devices and browsers
- Identify root causes of application performance problems
- Integration with automation and service management
tools - Analysis of business KPIs and user journeys
- Domain-agnostic analytics capabilities for integrating data from 3rd parties
- Support for virtual desktop infrastructure (VDI) monitoring
Stay One Step Ahead with Synthetic Monitoring:
Web App Simulator
Imagine this: A fast-growing e-commerce company relies heavily on its customer portal for sales — but their users are spread across the globe. A slight slowdown in New York or a checkout error in London could mean thousands in lost revenue before anyone even notices.
Instead of waiting for customers to complain, they can deploy eG Enterprise’s Web App Simulator to proactively monitor their web application around the clock.
Using our Web App Simulator, they:
The Results:
- Pinpoint problems before customers experience them
- Benchmark and compare performance across regions
- Reduce revenue risk by catching outages and slowdowns early
- Free up IT teams from manual testing with automated, intelligent monitoring
- Deliver a seamless, reliable user experience no matter the time zone
With Web App Simulator, businesses move from reactive to proactive — ensuring their web applications are always ready for prime time.
Deliver exceptional digital experiences — before users even notice a problem. Monitoring Heterogeneous and Hybrid IT Environments
Supported by eG Enterprise
- 01. 650+ Applications
- 02. Public cloud environments
- 03. Virtualization platforms
- 04. Operating systems
- 05. Storage devices
- 06. Network devices
- 07. Custom applications
- 08. Containers
Unify your IT infrastructure and
application monitoring in a single pane of glass
 |
Be the first to know when the user experience of web applications is affected, when, where, and how |
 |
Enhance application uptime, and be proactively alerted to performance deviations |
 |
Boost customer satisfaction by ensuring rich user experience for web applications |
 |
Increase ROI and productivity by ensuring peak performance of applications on-premises and in the cloud |
 |
Accelerate troubleshooting of issues, using deep diagnostics and actionable insights |
 |
Provide metrics, analysis and reports for a broad range of stakeholders: Management, business owners, IT operations, architects, developers, and helpdesk |
 |
eG Enterprise is the only single pane-of-glass, virtualization-aware, auto-diagnostic IT infrastructure performance monitor |
 |
Gain actionable answers to performance issues, wherever they originate, from application code to bare metal |
 |
Understand the impact of infrastructure issues on application health and user experience |
 |
Unify IT performance monitoring, alerting, diagnosing, reporting, and capacity planning in a single console |
 |
Ensure a great user experience and dramatically improve IT efficiency |
 |
Benefit from flexible deployment options (on-premises and SaaS) and IT monitoring approaches (agentless and agent-based) |
 |
20+ years of delivering exceptional monitoring capabilities to IT teams and enterprises |
 |
End-to-end monitoring gets you to the root-cause of problems faster in application or infrastructure tiers |
 |
Dedicated support team in every region to provide quick support at any time of the day |
Don’t settle for a tool that makes you do heavy lifting.
Choose a solution built to make your team more confident, more capable, and more in control.

Frequently Asked Questions (FAQs) about Application Performance Monitoring (APM)
APM is the ability to monitor applications in-depth to determine how well they are performing and to be able to discover and troubleshoot application bottlenecks.
Not at all. While code-level problems are important, they're just one piece of the puzzle. Application efficiency can also be impacted by deeper infrastructure layers — like misconfigured JVMs, database slowdowns, or resource constraints. A true APM solution looks beyond the code to uncover issues across the full application stack, ensuring nothing slips through the cracks.
No changes are required to your code. Most APM tools — including eG Enterprise — use a technique called byte-code instrumentation. This allows the monitoring agent to automatically capture method calls, database queries, and external requests within Java or .NET applications, all without touching your source code. The result? Detailed transaction flow maps that reveal exactly where time is being spent — no code rewrites needed.
Not anymore. Using multiple tools often leads to higher costs, data silos, and slower troubleshooting. eG Enterprise combines application and infrastructure monitoring in one unified platform, reducing licensing, training, and operational overhead. You get complete visibility across the stack — at a fraction of the cost of maintaining separate solutions.
A comprehensive APM solution should cover all the critical layers that impact user experience. At a minimum, it should include:
These capabilities work together to deliver the visibility needed to optimize performance, improve uptime, and ensure great user experience.
Cloud APM focuses on monitoring applications hosted in public, private, or hybrid cloud environments. It provides real-time insights into performance, availability, and user experience — no matter where the application is running.
With eG Enterprise, you get end-to-end visibility into cloud-native services, virtual infrastructure, and application health in a single pane of glass. Whether you're using AWS, Azure, or other cloud platforms, eG helps you monitor, diagnose, and optimize performance across the entire delivery chain.
Yes. eG Enterprise is built to monitor complex hybrid environments — where parts of your application run in the cloud and others remain on-premises. It provides a unified view across both, correlating performance data from cloud services, on-prem infrastructure, application tiers, and user experience. Whether you're migrating to the cloud, running in a hybrid model, or managing multi-cloud deployments, eG ensures seamless visibility and faster issue resolution from end to end.
Application Performance Monitoring (APM) provides focused visibility into application performance, transactions, errors, and user experience. Observability takes a broader approach by correlating metrics, logs, traces, and other telemetry across applications and infrastructure. For organizations evaluating monitoring solutions, APM can provide focused application-level insights while fitting into a broader observability strategy.