Monitoring Microsoft Teams
To monitor the managed Microsoft Teams, login to the eG management console as a user with monitoring privileges.
Browse the Components At-A-Glance section of the Monitor Home page that appears, and locate the Microsoft Teams component type. Click on the bar that corresponds to this component type. This will lead you to the Layers tab page, where you can view the monitoring model for Microsoft Teams (see Figure 1).
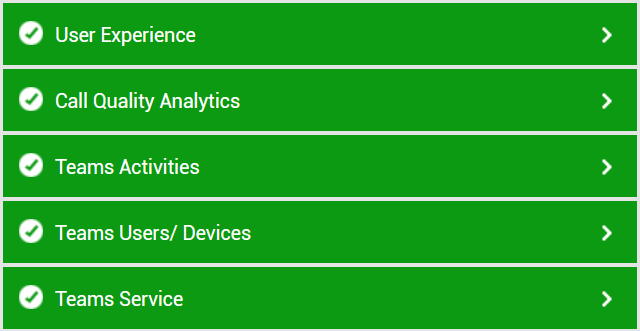
Figure 1 : Layer model for the Microsoft Teams component
Each layer of Figure 1 is mapped to tests that report on a wide variety of KPIs such as availability, service health, resource usage, and operational health of Microsoft Teams. Using these metrics, administrators can find quick and accurate answers to the following performance queries:
- Is HTTP/S connection to the Office 365 portal available? Was any latency noticed in the connection?
- Is network connection to Microsoft Teams available? If so, how quickly is it responding to network requests?
- Is any service experiencing a service incident? What type of an incident is it?
- Which are the user license types for which the Microsoft Teams is pending provisioning/pending activation?
- Which type of device is most commonly used by the users to access Microsoft Teams? How many unique users are logging into Microsoft Teams using different devices?
- How many users are inactive on Microsoft Teams?
- How many teams/channels are created on Microsoft Teams?
- How many calls/meetings/private chat mesages were initiated/attended by each user on Microsoft Teams?
- Which users have recently logged in?
- How many channels were added/removed from a team?
- How many bots/tabs/connectors were added/removed/modified from a channel?
- How many times tenant settings were modified by the global administrator?
- How many members were added/removed from a team?
- How many times role of a member was modified in a team?
- How many users were unique to initiate calls/meetings/private chat messages/team chat messages?
- How many audio streams were established? Among them, how many were classified as poor streams? and why were they classified as poor streams?
- How many video streams were established? Among them, how many were classified as poor streams? and why were they classified as poor?
- How many video-based screen sharing (VBSS) streams were established? Among them, how many were classified as poor streams? and why were they classified as poor?
- How many call failures/media failures were noticed?
- How many users provided poor feedback rating while being the first endpoint and second endpoint?
- Was there any network degradation?
- Was packet loss noticed while connecting to Microsoft Team calls?
For more information on the Network layer, refer to the Monitoring Unix and Windows Servers document. This