eG User Sessions Test
In environments where the eG management console is accessed by multiple concurrent users, administrators might want to know how many distinct users are logged in currently, and the total session load on the eG manager. This information would enable administrators to audit user accesses to the eG manager and instantly identify unauthorized accesses (if any) that are currently active on the manager. This test provides administrators with these session-centric insights.
Target of the test : The eG Manager
Agent deploying the test : An internal/remote agent
Outputs of the test : One set of results for the eG manager being monitored.
| Parameter | Description |
|---|---|
|
Test period |
How often should the test be executed . |
|
Host |
The host for which the test is to be configured. |
|
Port |
The port number at which the specified host listens. |
|
JMX Remote Port |
Here, specify the port at which the JMX listens for requests from remote hosts. In the <EG_MANAGER_INSTALL_DIR>\manager directory (on Windows; on Unix, this will be the /opt/egurkha/manager directory) of the eG manager, you will find a management.properties file. Set the port defined against the com.sun.management.jmxremote.port parameter of the file as the JMX Remote Port. |
|
User, Password, and Confirm Password |
By default, JMX requires no authentication or security. Therefore, the User, Password , and Confirm Password parameters are set to none by default. |
|
JNDIName |
The JNDIName is a lookup name for connecting to the JMX connector. By default, this is jmxrmi. If you have registered the JMX connector in the RMI registry using a different lookup name, then you can change this default value to reflect the same. |
|
JMX Provider |
This test uses a JMX Provider to access the MBean attributes of the eG manager and collect metrics. Specify the package name of this JMX Provider here. By default, this is set to com.sun.jmx.remote.protocol. |
|
Timeout |
Specify the duration (in seconds) for which this test should wait for a response from the eG manager. If there is no response from the eG manager beyond the configured duration, the test will timeout. By default, this is set to 240 seconds. |
|
DD Frequency |
Refers to the frequency with which detailed diagnosis measures are to be generated for this test. The default is 1:1. This indicates that, by default, detailed measures will be generated every time this test runs, and also every time the test detects a problem. You can modify this frequency, if you so desire. Also, if you intend to disable the detailed diagnosis capability for this test, you can do so by specifying none against DD frequency. |
|
Detailed Diagnosis |
To make diagnosis more efficient and accurate, the eG Enterprise embeds an optional detailed diagnostic capability. With this capability, the eG agents can be configured to run detailed, more elaborate tests as and when specific problems are detected. To enable the detailed diagnosis capability of this test for a particular server, choose the On option. To disable the capability, click on the Off option. The option to selectively enable/disable the detailed diagnosis capability will be available only if the following conditions are fulfilled:
|
| Measurement | Description | Measurement Unit | Interpretation |
|---|---|---|---|
|
Active sessions |
Indicates the number of sessions that are currently active on the eG manager. |
Number |
This is a good indicator of the current load on the eG manager. |
|
Failed sessions |
Indicates the number of sessions that failed during the last measurement period.
|
Number |
Use the detailed diagnosis of this measure to view the details of the sessions that failed. These details include the user who initiated the session, the IP/host name of the host from which the session originated, when the session began, and when the session last accessed the eG manager. |
|
Unique user sessions |
Indicates the number of distinct users who are currently logged into the eG manager. |
Number |
Use the detailed diagnosis to know which unique users are logged in. |
The detailed diagnosis of the Active sessions measure reports the host from which the active sessions originated and the session start time.
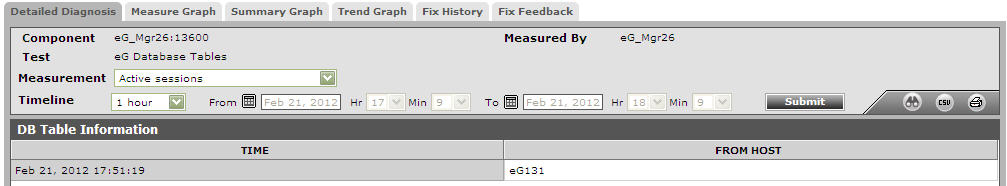
Figure 1 : The detailed diagnosis of the Active sessions measure