Home Page
In this section, we will discuss the Home page of the mobile app. This is the first page you will see immediately after logging into the mobile app. A single glance at Figure 1 will provide an overview of the health of the target environment.
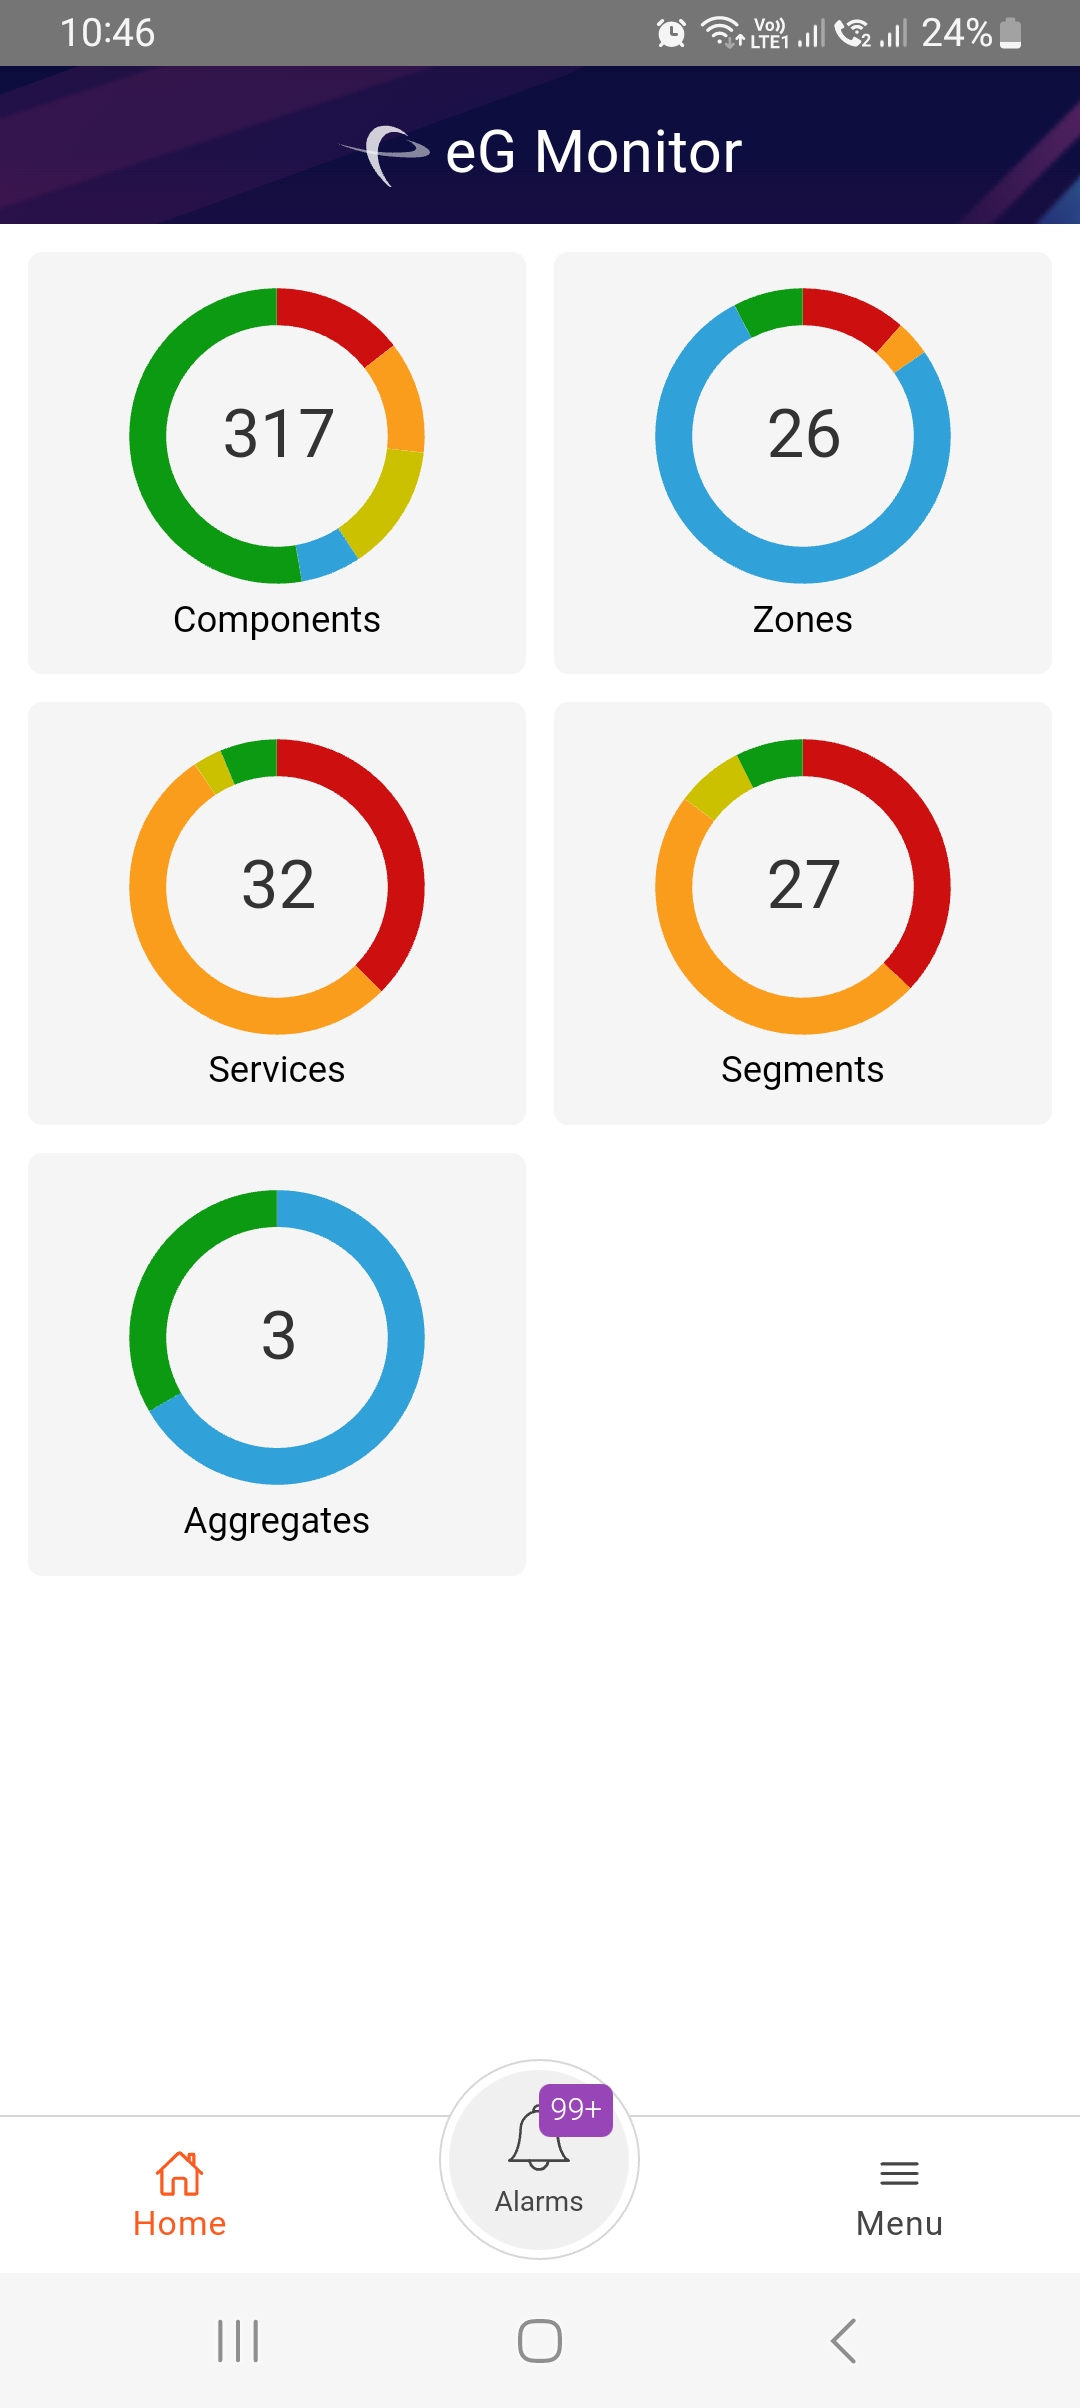
Since the health of an environment depends entirely upon the performance of each of its key ingredients - namely, the Components, Zones, Services, and Segments - this section takes the help of a doughnut chart to clearly indicate the number of zones, services, segments, aggregates and components that are in the Critical, Major, Minor, Normal, and/or Unknown states. The slices of the chart indicate the different states in which the managed zones/services/segments/aggregates/componentsarecurrently. The table below explains the color-coding scheme adopted by eG for indicating the states of the zones/services/segments/components:
|
State |
Color |
|---|---|
| Normal | Green |
| Critical | Red |
| Major | Orange |
| Minor | Yellow |
| Unknown | Blue |
From the size of the slices of the doughnut chart, you can instantly understand how healthy/unhealthy the target environment currently is. By clicking the zones/services/segments/components/aggregates doughnut chart, you can view the complete details of those elements in the target environment. For instance, if you click on the Components doughnut chart, you will be lead to a page that lists the complete list of configured components and their state along with a gauge chart (see Figure 2).
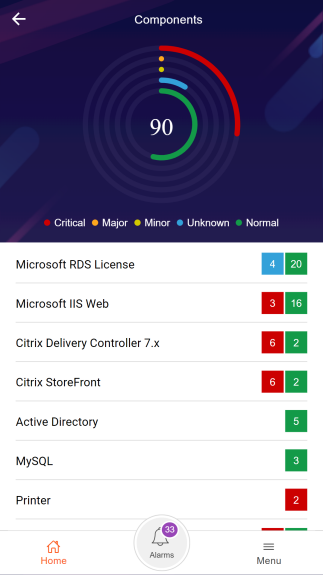
Use the legend given below the gauge chart to understand what state each color represents.
Below the gauge chart, you will find the complete list of component types that are managed in the target environment, and the number of components of each type that are presently monitored. Alongside, you will also find colored boxes indicating how many components of a type are in which state currently. From this graphical representation, you can quickly identify those types of components that are error-prone.
To know which components of a type are in a particular state presently, click on the box representing that state alongside the component type (as shown in Figure 1. Then, the list of components in that particular state will be displayed as shown in Figure 3.
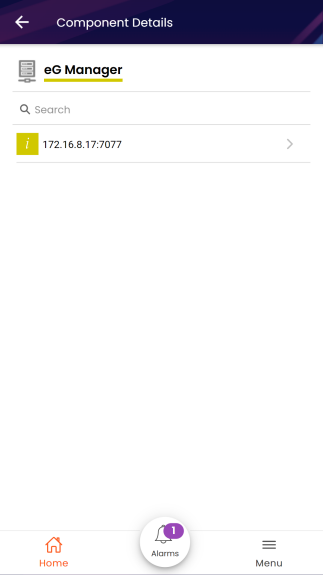
Figure 3 : The list of components in a Minor state
