Java transaction monitoring for code-level visibility

Get total visibility into Java application processing (methods, queries, API calls, etc.) without making any code changes. Identify the root-cause of slowness and provide insights for troubleshooting and application optimization.

Free Trial

Trusted by leading companies

Business transaction monitoring

A recent Gartner survey of enterprises indicated that user experience was the most important criteria when formulating application performance strategy. When user experience is reported as poor, discovering the cause of slow application transactions is paramount. But in today’s multi-tier, heterogeneous application architectures, it is challenging to determine what is causing a slowdown: is it the network, or the client, or the database query, or application processing, or an external web service call, etc.?

Monitoring and distributed tracing of business transactions provides clear visibility into which application tier is slowing down user access to applications and, in turn, affecting user experience.

Java Transaction Tracing - Why is the Transaction Slow?

Challenges

Java Transaction Tracing - Why is the Transaction Slow?

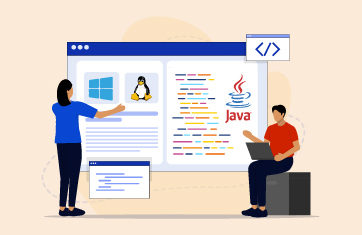
Java application architectures have evolved to include several hardware and software tiers. Production applications involve multiple load balanced web servers, several tiers of Java application servers and middleware, backend databases, messaging servers, transaction processing engines and external services. And, many of these tiers are inter-dependent. Therefore, it can be extremely challenging to diagnose which tier is causing the transaction to be slow and why. IT operations and DevOps teams need answers to key questions, including:

  • Which application tier is causing slowness?
  • Is there a code-level issue and if so, what line of code, in what method?
  • Are there any calls to remote services slowing down the transaction?

Total performance visibility into Java transaction processing with
eG Enterprise

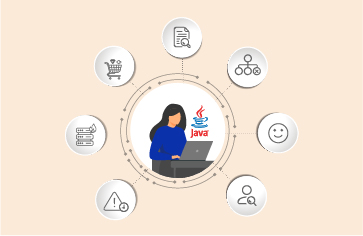
eG Enterprise provides complete visibility into Java transaction processing in every tier that supports the application. Using byte code instrumentation, it tags every transaction and traces it through the presentation tier, business logic tier and data tier. Method invocations, processing times and any exceptions are captured in the Java tiers, and any calls to non-Java tiers and external services are also tracked. For database accesses, the queries executed and the execution times are reported.

  • Metrics collected from all the different tiers are combined to present a holistic view depicting the entire transaction flow graph
  • IT admins, DevOps admins and application architects can easily isolate the tier responsible for causing high transaction response time
Java Transaction Processing with eG Enterprise
  • Issues in the application server and within custom application code can be easily identified
Licensed by number of operating systems, not by JVMs, eG Enterprise is one of the most cost-efficient application performance monitoring solutions in the industry.

eG Enterprise for Java transaction tracing

Get complete visibility into distributed Java transaction processing, so you can clearly identify and solve slow application response issues:

  • See a transaction flow graph that shows all the tiers processing a transaction; see response times at each tier
  • Identify if slowness is due to Java processing, SQL queries, external calls, web service API calls, etc.
  • See detailed diagnosis that points to the problematic method, exact SQL query or Java exception that is affecting user experience
See Demo

Features

Visualize runtime architecture of Java application

  • Using an advanced tag-and-follow approach, eG Enterprise learns all the different application tiers that a transaction passes through, and constructs the transaction flow path
  • Intuitive visual maps show the application runtime path for each request and the processing time spent at each tier
  • IT administrators and developers can easily and quickly pinpoint the root cause of transaction slowdowns in real time
  • Java business transaction monitoring using eG Enterprise is simple to deploy and non-intrusive. It does not require any special database access privileges, application topology configuration, or any code changes to trace transactions

Deep dive into application code-level issues

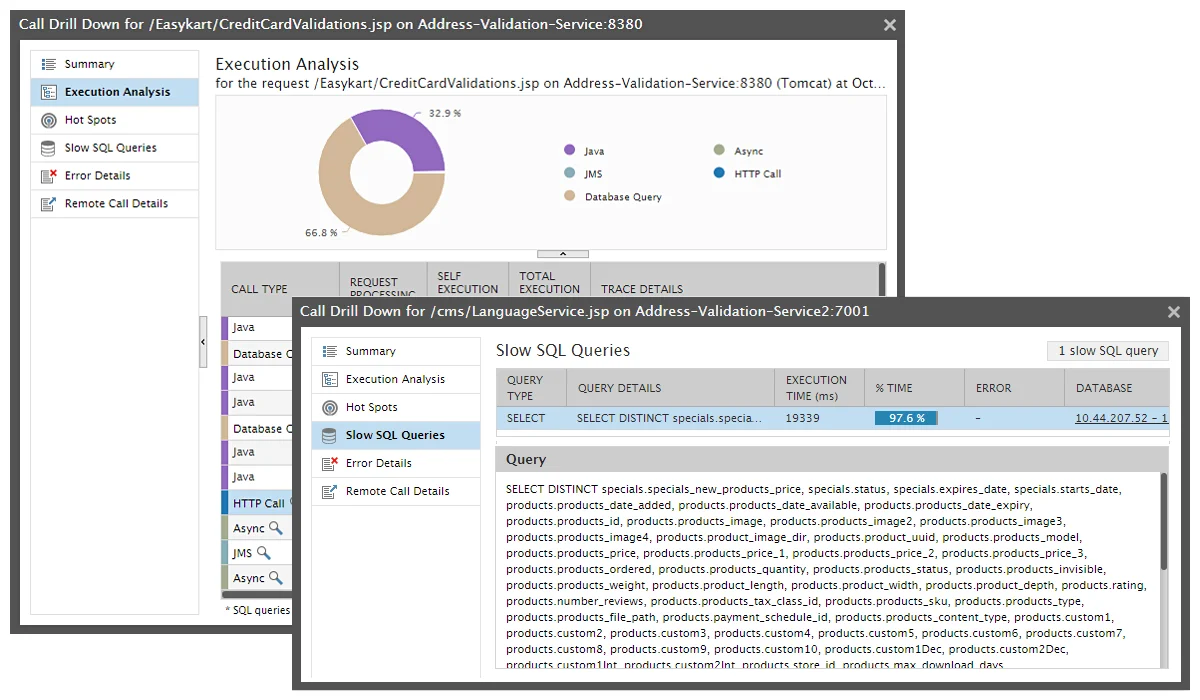
eG Enterprise allows you to easily analyze transactions by breaking down request processing time hop by hop, as the transaction flows through each application tier. With this information, you can:

  • Isolate problematic Java code that is causing errors or exceptions
  • Identify methods that are responsible for high request processing time
  • Drill down to the specific database query that is responsible for database slowness
  • Track down specific HTTP, JMS or web services calls that are slow
  • Quantify enterprise application responsiveness by tracking calls to SAP JCO, Jolt and other application APIs
  • Monitor transactions from both web browsers and native mobile applications

In-depth monitoring of JVMs and Java containers

For situations where Java application slowness is caused by bottlenecks in the Java container or JVM layers, eG Enterprise provides in-depth monitoring for most popular Java containers (Tomcat, WebLogic, JBoss EAP, WildFly, WebSphere, Glassfish, etc.) and JVMs (Oracle, Sun, JRockit, etc.). Using these insights, you can:

  • Correlate transaction slowdowns with performance issues in the application server
  • Diagnose memory leaks and out-of-memory exceptions
  • Optimize the heap and non-heap memory usage of a JVM
  • Measure CPU utilization of JVM and identify high CPU threads
  • Detect blocked and deadlocked threads
  • View the stack trace to find the exact line of code causing issues

Automated root cause diagnosis

Because user experience can be impacted by many factors outside of application performance, eG Enterprise goes far beyond identifying code level issues alone. Its universal monitoring technology provides visibility into every layer and every tier of the infrastructure that the Java application depends on.

A patented, virtualization-aware, root-cause diagnosis technology automatically discovers inter-dependencies between infrastructure tiers, correlates performance data across these tiers, and pinpoints the exact cause of issues. This eliminates guesswork and finger-pointing and enables IT operations teams, DevOps teams and developers to see exactly where the problem lies and where its effects are.


Supported platforms and technologies

Java Component Supported Platforms & Technologies
Java Runtime Environments Java 1.5, Java 1.6, Java 1.7, Java 1.8, Java 9, Java 10, Java 11, Java 12, Java 13,
Java 14, Java 15, Java 16, Java 17, JDK 19
JVM Vendors Java HotSpot VM, Oracle JRockit JVM, OpenJDK JVM, IBM J9, SAP JVM, Azul Zing, Amazon Corretto, Azul Zulu
Application Servers Apache Tomcat, JBoss EAP, JBoss AS, WildFly, Oracle WebLogic, IBM WebSphere, Spring Boot, Jetty, Undertow, Jakarta EE, GlassFish
Web Frameworks JSP, JSF, Servlets, Spring MVC, Apache Struts
Middleware Components Java EE (EJB, JMS Queue & Topic, RMI, JDBC, JavaMail, LDAP, JPA, Jolt, SAP JCO), Spring Application Framework
Web Services Protocols HTTP, SOAP, JAX-WS, JAX-RS, RESTful services
Web Services Implementations Apache Axis, Apache CXF, Jersey, Spring WS, Spring RS
Data Access Framework Implementations OpenJPA, Hibernate, iBATIS, Spring Data
Messaging Middleware Apache ActiveMQ, JBossMQ (HornetQ), WebLogic JMS, IBM MQ, Solace, Qpid
Enterprise Service Bus (ESB) Mule ESB
Databases Supported Oracle, Oracle RAC, SQL Server, MySQL, IBM DB2, IBM Informix, Postgres, MariaDB, HSQLDB, MongoDB, Cassandra, Redis, ElasticSearch etc.
NoSQL / Cache MongoDB, Redis, Ehcache
Async and External Programs Runtime.exec()
Enterprise Applications JD Edwards EnterpriseOne, SAP NetWeaver, Oracle PeopleSoft
Digital Experience / Content Management platforms Liferay, Atlassian Confluence
Search Engine Elasticsearch
E-Commerce suite SAP Hybris

Frequently asked questions (FAQs)
about Java transaction monitoring

Distributed Application Transaction Tracing is a technique to monitor the flow of application requests as they move through the application delivery chain. It involves monitoring the entire journey of the request across your IT infrastructure, from front-end to middleware, message queues, backend services, external dependencies, and databases.

To track application transactions, Application Performance Monitoring (APM) and observability tools typically use bytecode instrumentation and a "tag and follow" approach, where requests are uniquely identified, and processing times are noted at each tier of the delivery chain. This information is aggregated to present simple topology or application dependency map views that clearly highlight application bottlenecks.

Site reliability engineers (SREs), IT Operations and Application developers (AppDev) can use distributed transaction tracing to identify and troubleshoot requests that experience high traffic surges, response time slowness, service latencies or errors. APM tools that leverage distributed tracing can reveal slow HTTP calls, sub-optimal database queries, slow method or function calls, exceptions or errors, and other issues.

Distributed tracing offers multiple and varied stakeholders such as SREs, DevOps, AppDev, helpdesk or support engineers, business owners and IT operations several benefits:

  • Easily comprehend the complexities of your application stack: As requests traverse the application, APM automatically builds an interactive topology map that visualizes these relationships without the need for manual configuration or additional instrumentation.

    This provides end-to-end observability into all application components and dependencies, helping you quickly identify and troubleshoot issues. With intuitive topology and dashboards, you can easily comprehend the complexities of your application stack and delivery chain and ensure that there are no gaps or blind spots in your monitoring.

  • Understand service dependencies that may cause cascading issues: The end-to-end topology view or dependency map provided by distributed tracing allows SREs to have a comprehensive understanding of all service dependencies involved in each transaction. Such dependencies could be horizontal (between components of the same type) or vertical (between components of different types).

    This big picture view can help SREs identify any performance bottlenecks that may arise due to dependencies between services. For example, sub-optimal SQL can have a cascading effect on several upstream services. By having this bird's-eye view, SREs can make informed decisions about where to focus their attention and optimize the system for maximum performance.

  • Get early warnings when microservices are unhealthy: Distributed tracing can provide real-time insights into the performance and behavior of your microservices. By continuously monitoring your system's traces, you can detect anomalies and unusual patterns that could indicate the presence of a problem or failure before it affects end-users. This can help you take proactive measures to address the issue and minimize its impact on your system's overall performance.
  • Reduce mean-time-to-resolve (MTTR) and empower even non-tech stakeholders like helpdesk: The individual timing information is aggregated to provide a comprehensive, end-to-end analysis of the overall time it takes to process the transaction. The APM and observability tool also correlates the captured transaction ID with other relevant metadata and service identification information.

    This makes it easier for even non-technical helpdesk or support engineers to quickly triage all issues on the same APM and observability platform and avoid costly and time consuming “war rooms”. Instead, the helpdesk can forward the trouble ticket to the right stakeholder who can make any necessary optimization to resolve the issue.

  • Detect performance regressions caused by changes: Distributed tracing can help provide visibility into changes made in different versions of the software, making it easier to track down any issues or performance regressions that may occur because of those changes. This can ultimately reduce the overhead required for deployments and rollbacks, as teams are able to quickly identify and address any issues that arise.
  • Track specific user behavior: Distributed tracing enables the measurement of the time it takes to complete important user actions, such as adding to cart or making a payment. Traces provide insights into backend bottlenecks and errors that may be negatively impacting the user experience.
  • Polyglot development support: Distributed tracing is programming language agnostic and can work with any monitoring vendor or runtime environment. It allows tracing of requests across different systems and services, providing freedom and flexibility to developers.

  • Manual instrumentation can be challenging: This involves modifying your code to enable tracing. This process can be time-consuming and error-prone, leading to bugs in your application. Additionally, the need for manual instrumentation may vary depending on the language or framework used in your application, resulting in missing traces.
  • Incomplete or incorrect traces: It can be challenging to do a complete full-stack distributed tracing by yourself. It can be difficult to know which parts of your code to instrument and how to do it correctly. This can result in incomplete or incorrect traces, which can make it harder to diagnose and fix performance issues in your application. Fortunately, automatic APM solutions solve this problem by integrating the frontend and the server-side traces and showing them in one cogent request topology.
  • DIY tracing can consume valuable engineering time: Manual instrumentation for distributed tracing can be a time-consuming task that consumes valuable engineering time, especially as your application becomes more complex. Additionally, it can introduce unintended bugs into your application if developers are not familiar with bytecode instrumentation or context propagation techniques for complex microservices.
  • Correlating frontend to server-side: There are challenges with many distributed tracing platforms that primarily focus on backend monitoring. As a result, visibility is often limited to when a request reaches the first backend service, making it difficult to identify the root cause of performance issues especially when the culprit is the frontend. SREs may struggle to determine whether the frontend or backend team should address them. To achieve full stack correlation, it's essential to link instances of page or ajax requests (frontend browser telemetry) with instances of business transactions (backend service telemetry).
  • Some distributed tracing solutions may have limitations when it comes to monitoring asynchronous processes and collecting payload data – for example, HTTP request body, JMS or Kafka messages. This can make it challenging to identify and debug issues in pre-production environments where full payload data is often required. Therefore, it's important to consider monitoring tools that can drill through asynchronous processes and collect full payload data. This will provide developers with a more complete picture and gain insights into the end-to-end flow of data across services and identify performance bottlenecks or errors that might be causing issues.
  • Big data problem: A high-throughput system can generate millions of traces per minute, making it difficult to identify and monitor the most relevant performance data. However, there are tools available to help you prioritize and surface the most useful performance data for your applications.

A full-stack APM and observability tool can preempt the need for manual instrumentation by automatically discovering all the components in your IT infrastructure and enabling end-to-end tracing without any manual intervention. This saves valuable engineering time and reduces the chances of introducing bugs in your application.

Yes and no.

For transaction tracing to be enabled, there are two choices:

  • Choice #1: Application code changes - To capture and propagate trace information, you can instrument your code by adding snippets or using tracing libraries provided by the distributed tracing tool. This involves generating unique trace and span IDs for each request, propagating them across service boundaries, and annotating key operations or methods with trace spans. While this choice offers greater control over tracing, it also introduces additional coding and testing overhead and requires manual modifications to your code.
  • Choice #2: Automatic APM without code changes - With automatic APM tools, you can enable transaction tracing without modifying your application code. These tools utilize a single agent to instrument each service involved in a request, capturing timings and troubleshooting information within each span. This eliminates the need for extensive manual code modifications and allows for a quick and efficient setup.

Both options enable the tracking of request flows and provide valuable insights for troubleshooting and performance analysis. Depending on your use case and available resources, you may consider alternative approaches, such as automatic APM solutions, which offer simplified instrumentation without the need for extensive code changes.

Distributed transaction tracing can introduce several overheads:

  • Latency: Tracing SDKs may introduce additional latency and consume system resources. Be sure to assess the impact and choose an efficient tracing implementation to minimize the performance overhead.
  • Network overhead: Distributed tracing generates and transmits trace data across the network. This can increase network traffic and consume bandwidth, especially in highly distributed environments with numerous services generating trace data.
  • Storage overhead: Distributed tracing generates a significant amount of data, including span information, metadata, and context. Storing and retaining this data can require substantial storage resources, especially in systems with high transaction volumes or long trace retention periods.

Transaction tracing can help detect a variety of problems in an application. Some common problems that can be detected through transaction tracing include:

  • Performance bottlenecks: Transaction tracing can identify slow and inefficient operations, such as slow database queries, network latency, or resource-intensive processes, that contribute to overall performance bottlenecks.
  • Response time issues: By tracing the complete journey of a request, transaction tracing can pinpoint the specific components or services that contribute to slow response times, helping to identify and resolve latency issues.
  • Error and exception tracking: Transaction tracing can capture errors and exceptions that occur during the execution of a request, providing valuable insights into the root causes of failures and helping in debugging and troubleshooting efforts.
  • Dependencies and inter-service issues: Transaction tracing allows for the visualization and analysis of dependencies between different services and components within a distributed system. It can help identify issues related to service communication, such as failures, timeouts, or misconfigurations.
  • Resource utilization: By tracing transactions, it is possible to analyze resource consumption patterns and identify areas where resources are underutilized or overutilized, enabling optimization and efficient resource allocation.
  • Complex workflow analysis: Transaction tracing enables the understanding of complex workflows and the interactions between different components, making it easier to identify potential bottlenecks, inefficiencies, or areas for optimization.
  • Scalability and load balancing: Transaction tracing can highlight load imbalances or uneven distribution of requests across services, aiding in the identification of scalability issues and enabling better load balancing strategies.

These are some common prerequisites to consider for Java transaction tracing:

  • Instrumentation library: You will need to have an instrumentation library or agent installed in your Java application. This library is responsible for capturing and collecting the necessary tracing data.
  • Runtime environment: Verify that your application environment is supported by the Java Agent provided by your chosen monitoring tool. Some libraries may require specific versions of Java or have compatibility limitations with certain application servers or containers.
  • Compatibility with frameworks: Ensure that the instrumentation library you choose is compatible with the Java frameworks and libraries used in your application. Different libraries may have specific support for popular frameworks like Spring, Java Servlets, or JAX-RS.
  • Configuration and setup: You will need to configure the instrumentation library to specify the desired level of tracing, enabling or disabling specific features, and defining any custom settings or sampling rates.
  • Distributed tracing backend: Set up a compatible distributed tracing backend or platform to receive and process the captured tracing data. This backend could be hosted locally or in the cloud and should be capable of storing and visualizing the traced transactions.

With an APM tool, all this is automatically made available to you out of the box.

Yes, transaction tracing can work even if multiple technologies are involved in an application, such as Java and .NET.

  • Instrumentation libraries or agents: Each technology stack (Java, .NET, etc.) may require its own instrumentation library or agent to capture and propagate tracing data. These libraries or agents are responsible for instrumenting the code and capturing the necessary information for tracing.
  • Cross-platform communication: For transaction tracing across multiple technologies, it's important to establish a mechanism for cross-platform communication and propagation of trace context. This allows the tracing information to be passed between different components or services implemented in different technologies. Common approaches include using standardized trace context headers or formats, such as OpenTelemetry or W3C Trace Context.
  • Tracing backend and visualization: Set up a tracing backend or observability platform that can receive and process the traced data from multiple technologies. This backend should be capable of aggregating and correlating the tracing information to provide a unified view of the distributed transactions involving different technologies.

Automatic APMs offer comprehensive visibility by capturing trace information across different technologies, enabling a holistic view of request flow and transaction behavior. They enhance troubleshooting, facilitate efficient root cause analysis, ensure cross-platform compatibility, drive proactive performance optimization, and streamline collaboration among teams for improved system performance and reliability.

Agentless transaction tracing refers to gathering information about the flow of requests and responses across components in a distributed system without installing any software agent.

Several options exist:

  • Network traffic analysis: By capturing and inspecting network packets, it's possible to extract information about the interactions between components and identify the sequence of requests and responses.
  • Log parsing: Log files generated by different components can be parsed and analyzed to reconstruct the flow of transactions.

In general, while agentless transaction tracing can provide visibility into the flow of requests and responses, it may have limitations compared to agent-based distributed tracing approaches.


Start your free trial or schedule a custom demo with an engineer

  • Works on cloud environments, hybrid cloud setups and on-premises deployments
  • Deploy eG Enterprise using our SaaS platform or on-premises
  • Suitable for monitoring applications, digital workspaces and IT infrastructures
Please Enter Valid Work Email
eG Enterprise