Monitor network availability, faults, performance and usage from one console. Supports SNMP polling, traps, syslogs, NetFlow and more.
Free TrialTrusted by leading companies


Although the emphasis of IT performance monitoring and management has turned towards application performance, network device monitoring is still important because any slowdown in the network tier can affect application performance.
eG Enterprise Universal Insight for networks is a 100% web-based performance monitoring, diagnosis and reporting solution for heterogeneous network infrastructures. While IT operations staff can use eG Enterprise for real-time monitoring, alerting and diagnosis, IT architects can use this network availability monitor for capacity optimization and planning.

As IT infrastructures have become business-critical, the importance of network monitoring has not diminished. Performance issues in the network tier adversely affect the performance of applications. From an administration perspective, it is important to differentiate network performance issues from server, storage, application and virtualization performance issues.
At the same time, network infrastructures have become more complicated with the introduction of a number of new and heterogeneous devices (such as virtual switches, network caches, reverse proxies, secure gateways, connection managers, SAN switches, VOIP devices, and wireless devices).
Making it imperative to choose the best enterprise network monitoring tools to ensure optimal performance.

eG Innovations delivers a robust, reliable and extremely valuable solution to deliver maximum uptime and user satisfaction. Pre-emptive alerting helps us to address performance issues immediately before they affect system and application availability.![]()

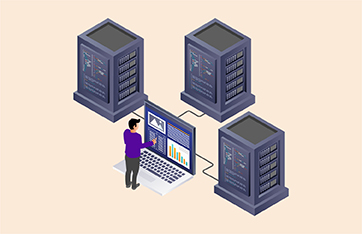
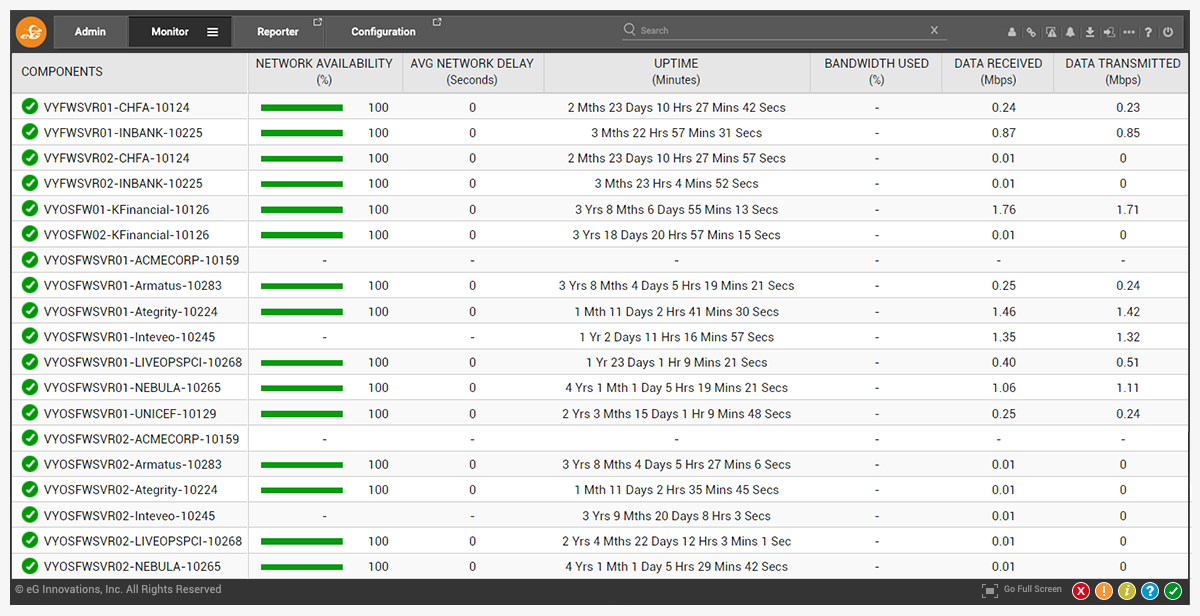
eG Enterprise provides unified monitoring of all network devices from one console, enables problems to be clearly demarcated and alerts to be proactively triggered of problems well before users notice.

eG Enterprise, the enterprise network monitoring software provides detailed insights through key metrics, ensuring optimal network performance and reliability.
| Interface availability | Packet drops | Hop-by-hop latency |
| Device uptime | Memory usage of device | Network throughput |
| Hardware status | CPU usage of device | Performance from different locations |
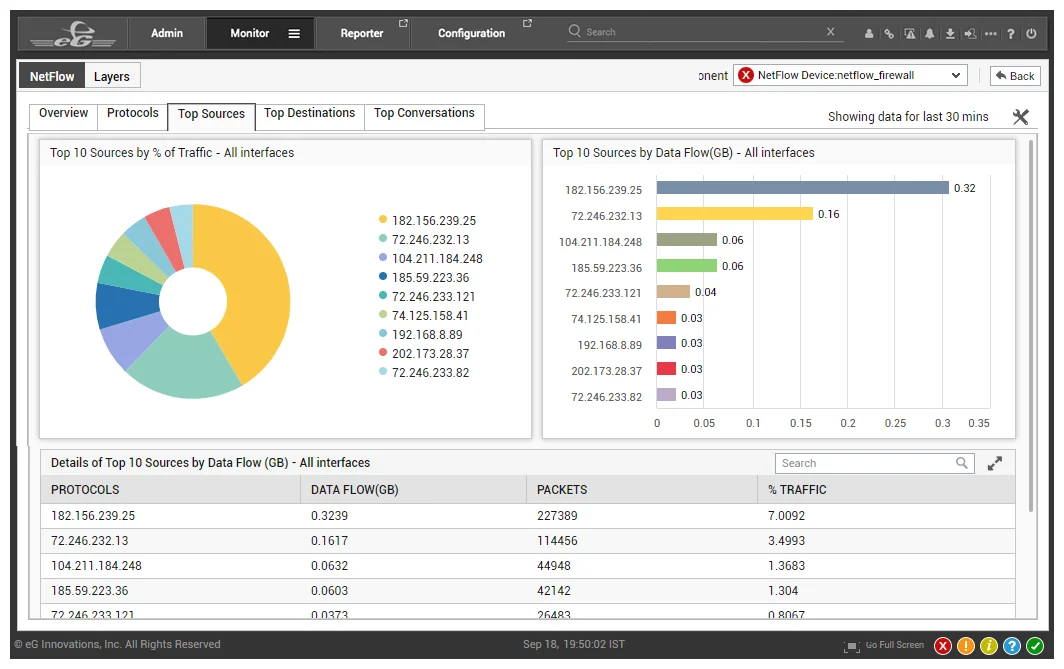
| Bandwidth usage | CRC errors | Top traffic sources |
| Network availability | Connections to target servers | Top traffic destinations |

Network monitoring refers to tracking the health of network devices in an IT infrastructure/datacenter, including switches, hubs, routers, temperature sensors, IP cameras, firewalls, load balancers, security devices, network proxies, wireless access points, and so on.
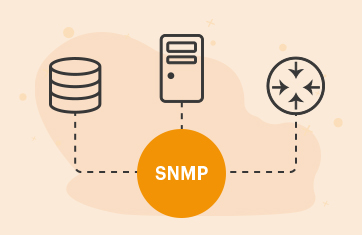
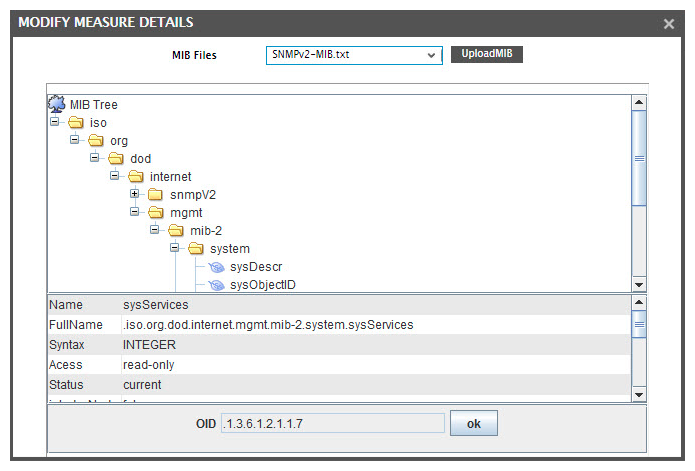
Most network devices support the Simple Network Management protocol (SNMP). SNMP polls and traps are two ways in which an enterprise network monitoring tool gets details about the health of the network devices it monitors.
Yes, SNMP polling and trap reception are complementary. SNMP polling is done from a remote node to a target device, to periodically collect statistics about the usage and performance of the target device.
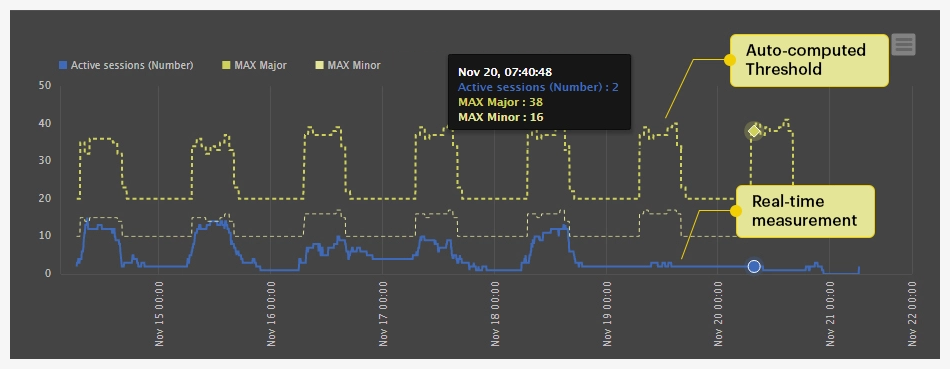
Since SNMP polling is performed at periodic intervals, a graph of each metric vs. time can be drawn to compare how the metric has been varying. SNMP polling is ideally suited to trap usage and performance metrics.
If a device wants to alert a monitoring tool that an abnormal event has occurred, it does so using SNMP traps. With SNMP traps, the monitoring tool has instant access to information about a problem and it does not have to wait for the next SNMP polling cycle.
Yes, eG Enterprise supports SNMP v1, v2 and v3, and devices supporting different versions of SNMP can be monitored in the same web console.
No, many modern network devices support REST APIs. For monitoring those devices, REST APIs are used by eG Enterprise. While SNMP has a simple tabular format for the output, there is no such restriction with modern APIs.
eG Enterprise adopts a horizontally scalable architecture for network monitoring. SNMP polling is done in a multi-threaded manner, so multiple devices are targeted simultaneously. This allows a single poller to monitor hunreds of devices. For additional scaling, you can deploy multiple SNMP pollers in the infrastructure.
Yes, the SNMP poller (external agent) must be located closest to the devices it is monitoring. If a distributed network is to be monitored, it is advisable to deploy an SNMP poller in each location. This strategy will reduce the round trip time for SNMP polls, and will ensure that raw SNMP responses from devices are not transmitted over a WAN.
The eG Enterprise architecture has self monitoring and recovery capabilities built-in. However, this cannot guard against a failure of the OS/system on which the SNMP poller has been deployed. For such cases, it is preferable to deploy the eG SNMP poller/agent as a Windows/Linux HA cluster service. This will offer a highly available configuration.