English
 Deutsch
 Espanol
 Français
 Portuguese
 中文
中文 한국어
한국어 日本語
日本語


Best Kubernetes Monitoring Tools for Enterprise Environments
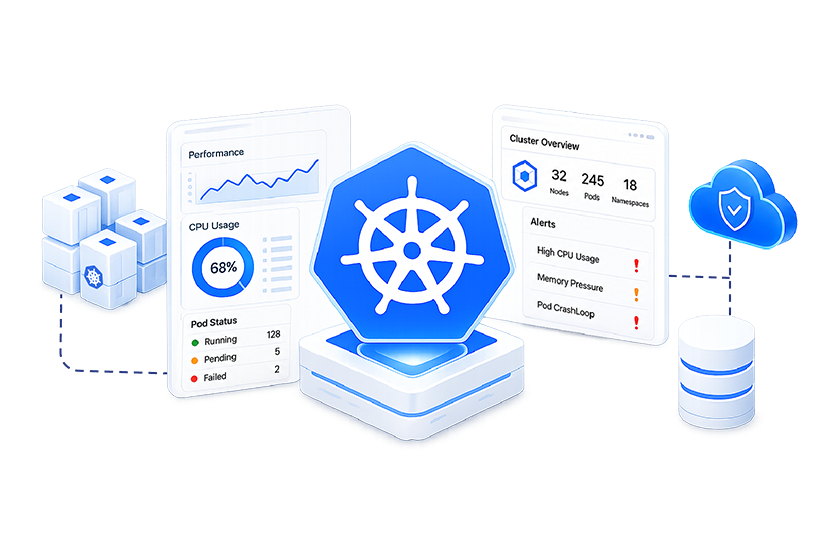
Modern enterprises rely heavily on Kubernetes to orchestrate containerized applications at scale. However, as Kubernetes environments grow in complexity, maintaining visibility into application performance, cluster health, and infrastructure dependencies becomes increasingly challenging. Choosing the right Kubernetes monitoring tools is essential for ensuring application availability, optimizing resources, and delivering consistent user experiences.
This guide explores the key features enterprises should look for, compares leading monitoring approaches, and explains how to select the best solution for your Kubernetes environment.
Why Kubernetes Monitoring Matters
Kubernetes environments are highly dynamic. Containers are constantly created, destroyed, and moved across nodes, making traditional monitoring approaches insufficient. Effective Kubernetes monitoring provides visibility into every layer of the ecosystem, from containers and pods to nodes and clusters.
Common Kubernetes Performance Challenges
Pod Failures
Pods can fail due to application crashes, configuration issues, image deployment problems, or infrastructure constraints. Without proper monitoring, these failures may go unnoticed until they impact users.
Resource Exhaustion
CPU, memory, storage, and network limitations can quickly affect application performance. Resource bottlenecks often result in degraded services and poor user experiences.
Cluster Instability
Scaling events, node failures, misconfigurations, and orchestration issues can impact cluster stability. Monitoring helps detect early warning signs before they become critical incidents.
Network Issues
Communication between services is vital in Kubernetes environments. Latency, connectivity problems, and service discovery failures can significantly affect application performance.
Business Benefits of Kubernetes Monitoring Tools
Improved Application Availability
Continuous monitoring enables proactive issue detection and minimizes disruptions to business-critical applications.
Better Resource Utilization
Organizations gain insights into capacity consumption, helping optimize infrastructure costs and prevent overprovisioning.
Faster Troubleshooting
Comprehensive visibility reduces mean time to resolution (MTTR) by helping teams identify the root cause of incidents quickly.
Reduced Downtime
Real-time monitoring and automated alerts allow teams to address problems before they impact customers and business operations.
Must-have Kubernetes Monitoring Features
When evaluating Kubernetes monitoring tools, enterprises should prioritize features that provide comprehensive observability across the entire Kubernetes ecosystem.
Container Monitoring
Containers are the foundation of Kubernetes workloads. Effective Docker container monitoring tools help teams track CPU usage, memory consumption, restarts, and performance anomalies at the container level.
Pod Monitoring
Pods host one or more containers and represent the primary deployment unit in Kubernetes. Monitoring pod health, status changes, restart counts, and resource usage is essential for maintaining application performance.
Node Monitoring
Nodes provide the underlying compute resources for Kubernetes workloads. Visibility into node health, storage capacity, network throughput, and resource availability ensures stable operations.
Cluster Health
Cluster-wide monitoring provides insights into overall system performance, orchestration efficiency, and workload distribution. This helps teams identify systemic issues before they affect services.
Resource Utilization
Tracking CPU, memory, storage, and network utilization helps optimize costs while maintaining performance. It also supports accurate capacity planning.
Distributed Tracing
Modern applications often consist of multiple microservices. Distributed tracing reveals how requests flow across services, making it easier to diagnose performance bottlenecks.
Alerting & Notifications
Intelligent alerting ensures that teams are notified about critical issues promptly. Advanced monitoring solutions reduce alert fatigue by prioritizing actionable incidents.
Top Kubernetes Monitoring Tools
The strongest Kubernetes monitoring platforms typically combine metrics, logs, traces, and automation in one view. For enterprise teams, the best choice is usually the platform that scales across clusters, and supports cloud-native environments without adding too much operational overhead.
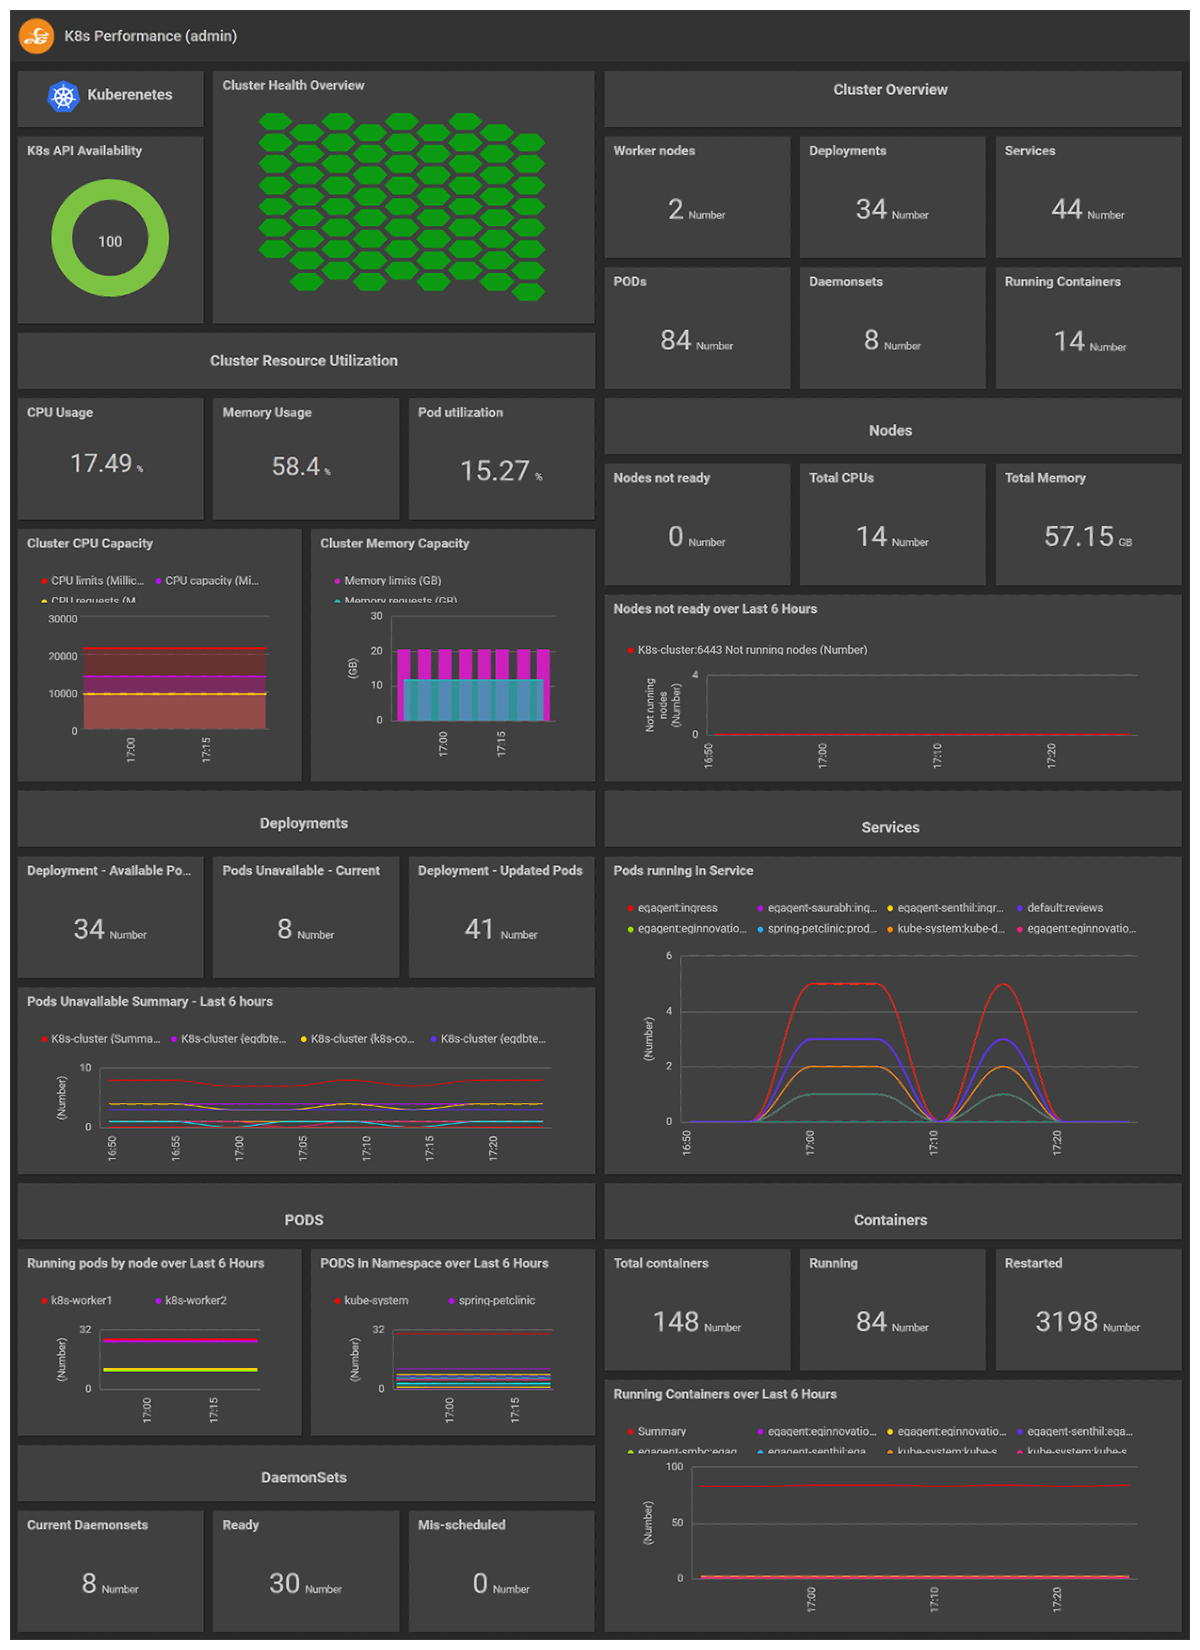
eG Enterprise provides Kubernetes monitoring with coverage for containers, pods, nodes, and cluster health, along with infrastructure and application context that helps operations teams diagnose issues faster. This is especially useful for enterprises that want Kubernetes visibility alongside broader hybrid cloud monitoring. Because eG correlates container, pod, and node metrics with the underlying network and application tiers in one view, teams can trace a Kubernetes issue to its actual root cause across 650+ supported technologies instead of stitching separate tools together.
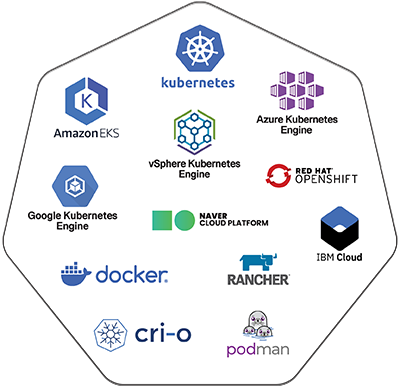
Kubernetes Monitoring Tools Comparison
When comparing Kubernetes monitoring tools, enterprises should evaluate ease of deployment, Kubernetes-native capabilities, scalability, dashboards, integrations, pricing, and enterprise readiness. A platform may look strong on charts and metrics alone, but it becomes more valuable when it supports alert routing, root cause analysis, and integration with the rest of the IT stack.
The right tool should also align with the organization’s cloud environment and DevOps maturity. Teams with larger clusters or multiple deployment environments usually need stronger automation and correlation, while smaller teams may prioritize simplicity and faster setup.
How to Choose the Right Kubernetes Monitoring Tool
Selecting the right monitoring solution depends on several factors.
Cluster Size
Large, distributed Kubernetes environments require scalable monitoring architectures capable of handling significant metric volumes.
Cloud Environment
Organizations operating across hybrid or multi-cloud deployments should prioritize solutions with broad platform coverage.
DevOps Maturity
Experienced DevOps teams may prefer flexible platforms, while organizations seeking simplicity often benefit from automated enterprise solutions.
Budget
Evaluate both licensing costs and the resources required to deploy, maintain, and manage the monitoring platform.
Integration Ecosystem
Choose a platform that integrates cleanly with existing infrastructure, CI/CD pipelines, service desks, logging systems, and observability tools.
Best Practices
To maximize the value of Kubernetes monitoring tools, follow these best practices:
Monitor Every Kubernetes Cluster
Ensure visibility across production, development, testing, and disaster recovery environments.
Configure Meaningful Alerts
Focus on actionable alerts that help teams prioritize incidents and reduce noise.
Track Resource Utilization
Continuously monitor CPU, memory, network, and storage consumption to optimize performance and costs. Learn more: Key Kubernetes Monitoring Metrics.
Combine Metrics, Logs and Traces
Unified observability provides valuable context and accelerates troubleshooting efforts.
Review Capacity Regularly
Use historical data and trend analysis to support capacity planning and future growth initiatives.
Learn more: Kubernetes Monitoring & Alerting Best Practices.
Conclusion
Kubernetes environments demand comprehensive visibility to maintain performance, availability, and operational efficiency. The best Kubernetes monitoring tools go beyond basic metrics collection by providing deep insights into containers, applications, nodes, clusters, and end-user experiences.
For enterprise environments, solutions like eG Enterprise stand out by delivering unified observability, intelligent analytics, automated root-cause diagnosis, and Docker container monitoring capabilities within a single platform. By selecting a monitoring solution that aligns with business requirements, infrastructure complexity, and growth objectives, organizations can improve reliability, reduce downtime, and confidently scale their Kubernetes operations.
Learn more about eG Enterprise’s Kubernetes monitoring capabilities, see: Kubernetes Monitoring Tools | eG Innovations.
Or see for yourself how eG Enterprise can help you monitor every Kubernetes environment from a single unified platform – schedule a demo today.
eG Enterprise is an Observability solution for Modern IT. Monitor digital workspaces,
web applications, SaaS services, cloud and containers from a single pane of glass.
Frequently Asked Questions
Kubernetes monitoring provides visibility into cluster health, application performance, resource utilization, and workload behavior. It helps organizations proactively detect issues, reduce downtime, and improve operational efficiency.
Key metrics include CPU and memory utilization, pod status, container restarts, node health, network latency, storage consumption, application response time, and cluster performance indicators.
Cluster monitoring focuses on the overall health and performance of the Kubernetes environment, while pod monitoring tracks the performance, availability, and resource usage of individual workloads running within the cluster.
The best solution depends on organizational requirements. Enterprises typically benefit from platforms that provide full-stack observability, automated root-cause analysis, scalability, security, and deep Kubernetes insights. eG Enterprise is particularly well-suited for organizations seeking comprehensive visibility across applications, infrastructure, containers, and user experience.