 Most SREs and IT Ops manage Java applications without source code access or communication with AppDev teams. When applications have performance issues those SREs or IT Ops teams deploying and maintaining the infrastructure often have to prove that it is the application at fault and supply information to the app supplier which provides evidence of the issue.
There are observability tools designed for IT Ops and SRE teams to troubleshoot Java applications, but they vary significantly in quality and coverage. One area many tools are particularly weak on is Java Lambda expressions.
Although a common code construction many tools require Java code changes to properly instrument and trace Java applications properly. Changing code simply isn’t an option for those teams. eG Enterprise is one of the few tools available that is designed to troubleshoot Java applications without changing the code.
In this blog, I’ll talk you through how our features ensure Java Lambda Expressions which will leave the SRE or Infrastructure administrator in a position to evaluate their Java monitoring capabilities. As an SRE or IT Ops monitoring a Java application, you need to check if your observability vendor supports instrumentation for Java lambda expressions. [Editor Note: Since writing this blog, Arun has published a follow-up article with deeper technical detail, see: Demystifying Java Lambda Expressions | eG Innovations].
In this article, I’ll explain:
- A quick primer on Java lambda expressions
- What you should expect to see in the distributed tracing and code-level diagnostics console
- How to know if you have gaps in lambda expressions instrumentation?
- Red flags when evaluating tool vendors
Java Lambda Expressions Primer
Java lambda expressions, introduced in Java 8 (in 2014) allow you to code blocks of Java logic without having to give them a specific method name. This enables a functional style of programming in Java.
In all other respects, they behave like a regular method – they accept a set of parameters as input and return a value as an output. They are largely seen as a replacement for anonymous inner classes.
What to Expect in Code-Level Diagnostics from a Java Monitoring Tool
Before we dive in deeper, let’s start with what we should expect to see. When you open code-level execution analysis of the spans belonging to a trace that involves lambda expressions, you should see something like this:
If your observability tool supports Java Lambda Expressions, you should expect to see:
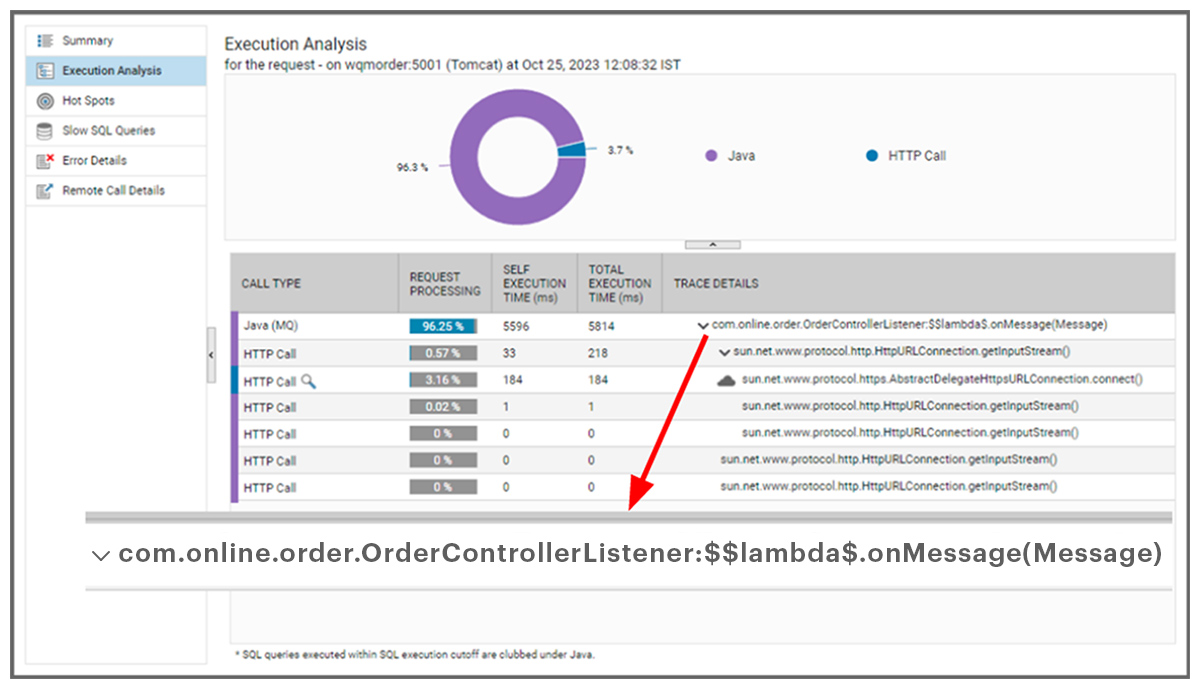
The JVM has a recognizable pattern for lambda expressions. It appends $$Lambda$n to the name of the defining class which contains the lambda code. If you see this, you can rest assured your tool supports Java lambda expressions.
A lot of enterprise business code is encapsulated within Lambda Expressions. I’ll give you an example of an enterprise application that sends and receives messages across a JMS queue.
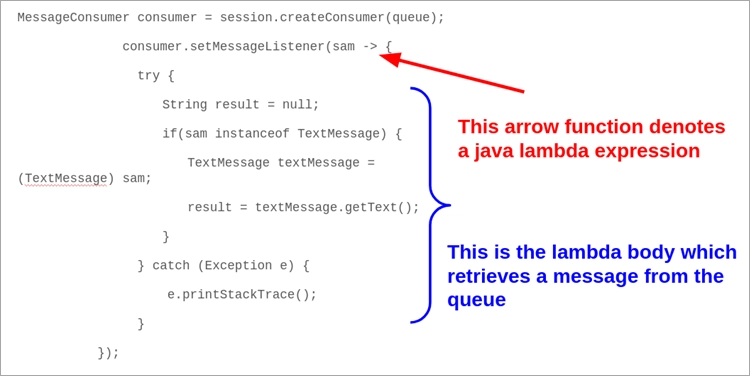
This is an example of a Java Lambda Expression that encapsulates a message receiver from a JMS queue. If your tool is blind to Java Lambda Expressions, you will also be blind to the BODY of whatever is contained within the expression.
This example highlights the challenges SREs and IT Ops will face if trying to troubleshoot applications using these code constructs. The lack of Java lambda instrumentation can put you in the dark since enterprise messaging and other business-critical functionality is encapsulated within lambda expressions.
You should also expect to see a fully stitched distributed trace. In the below screenshot, a Java lambda expression is involved in retrieving a message from the ActiveMQ JMS queue.
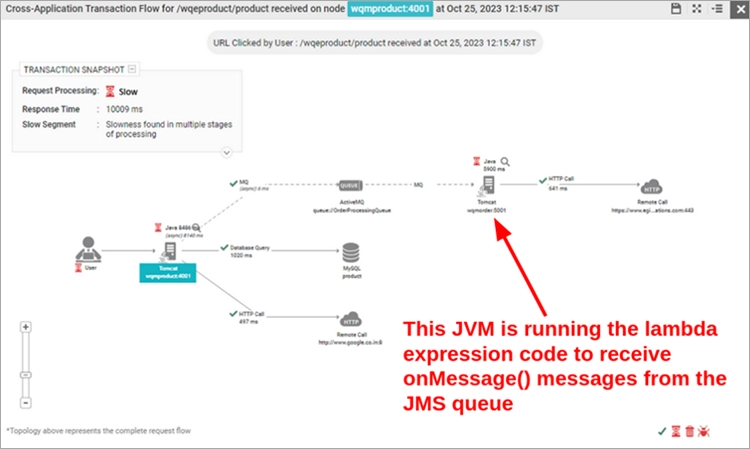
Your observability tool should stitch the entire request path even if involves Java lambda expressions. If the lambda makes external calls, you will be BLIND to everything that is executed from the lambda.
Identifying Gaps in Java Lambda Expressions Instrumentation
Symptom #1: Your distributed traces might be incomplete. As mentioned above, if the lambda expression made a JMS call or a 3rd party call, you will notice gaps in the distributed trace. Therefore, if the dependencies have slowness, you will be blind to these root-causes. These are black boxes you should seek to avoid.
Symptom #2: Code-level call graphs will be incomplete. You might see a big block of un-instrumented time. This indicates that there is a portion of the code execution that is not being instrumented by the observability tool.

Red flags in observability vendor evaluation –
a warning
I want to point out two red flags when it comes to evaluating Java observability tools that claim to do instrumentation for lambda expressions.
Red flag #1: Vendor wants you to change your source code with annotations such as @TraceLambda
There are some vendors who ask you to change your source code and signal to them that this code involves a Java lambda expression.
This is problematic for you as an IT Ops or SRE for the below reasons:
(a) You might not have access to source code. For example, it might be owned by a separate AppDev team
(b) You might have purchased a 3rd party Java library or application which internally uses lambda expressions.
(c) You might be in the dark as to whether your code base uses Java lambda expressions at all.
If you are a greenfield application, and you have complete control over your source code, this approach may suit you.
As an SRE or ITOps, changing source code to pepper them with annotations such as @TraceLambda is problematic and invasive.
In summary: Be cautious if a vendor suggests altering source code with annotations like @TraceLambda. Issues may arise if you lack access to source code, use third-party libraries, or are unaware of lambda expression usage.
Red flag #2: Vendor expects you to provide a user-defined Functional interface as a matching rule
Other tool vendors might expect you to set matching rules for user-defined functional interfaces such as LambdaMethodInterface. This involves a configuration change which is tedious and error prone.
This is problematic for many reasons:
(a) Many lambda expressions DO NOT use explicit user-defined functional interfaces.
(b) As an SRE or IT Ops, you may not even have access to the source code or the AppDev team who can authoritatively tell you that certain lambda expressions do not use functional interface.
In summary: Exercise caution when vendors demand user-defined functional interfaces as matching rules. Configuring such rules can be tedious, error-prone, and impractical due to the diverse nature of lambda expressions.
Final Thoughts
Lack of Java lambda expression instrumentation poses significant risks for SREs and IT Ops. While some vendors demand impractical code changes or configuration adjustments, choose APM and observability tools that provide seamless and automatic instrumentation for Java Lambda Expressions.
Evaluate APM and Observability tools closely. Choose tools that provide you automatic instrumentation for Java Lambda Expressions without needing you to change source code or provide explicit configuration of a functional interface which is a no-go.
Prioritize solutions that empower you without requiring invasive alterations to your source code or intricate functional interface configurations. Elevate your observability game by selecting tools that effortlessly align with the dynamic nature of Java Lambda Expressions.
eG Enterprise is an Observability solution for Modern IT. Monitor digital workspaces,
web applications, SaaS services, cloud and containers from a single pane of glass.
 Arun is Head of Products, Container & Cloud Performance Monitoring at eG Innovations. Over a 20+ year career, Arun has worked in roles including development, architecture and ops across multiple verticals such as banking, e-commerce and telco. An early adopter of APM products since the mid 2000s, his focus has predominantly been on performance tuning and monitoring of large-scale distributed applications.