Today, I’ll cover Shift Left Monitoring: A Pathway to Optimized Cloud Applications and how left-shifted troubleshooting of Spring Boot code issues using observability tooling can avoid production issues, unnecessary costs and improve product quality.
 Shift-left is an approach to software development and operations that emphasizes testing, monitoring, and automation earlier in the software development lifecycle. The goal of the shift-left approach is to prevent problems before they arise by catching them early and addressing them quickly.
When you identify a scalability issue or a bug early, it is quicker and more cost-effective to resolve it. Moving inefficient code to cloud containers can be costly, as it may activate auto-scaling and increase your monthly bill. Furthermore, you will be in a state of emergency until you can identify, isolate, and fix the issue.
Troubleshooting Java Spring Boot Pre-production
This is a recent real-world case where the data from their observability solution empowered a customer to avert a potential issue with an application that could have caused a major issue in a production environment.
The customer was testing a new version of a Java Spring Boot microservice using MariaDB as the backend, running behind Apache reverse proxy and AWS application load balancer. The end-to-end system was monitored using eG Enterprise throughout the testing cycle both prior to integrating the application changes and afterwards. Pre-production UAT (User Acceptance Testing) was performed and all UAT test cases passed.
However, on review of the eG Enterprise performance reports of the UAT (User Acceptance Testing) infrastructure following the recent application changes. The performance charts in the MariaDB performance dashboard deviated significantly from pre-deployment patterns.
On investigation a serious coding issue was discovered highlighting the importance of baselining both application and infrastructure behavior in such testing. Later I’ll also cover why the application UAT tests succeeded.
I’ll walk-through the key metrics and information captured by eG Enterprise that allowed the customer to diagnose and analyze the full-stack behavior.
Spring Boot and Kubernetes
Spring Boot is an open-source Java-based framework that simplifies the development of production-ready, stand-alone, and web-based applications. Kubernetes (K8s) is designed to manage containerized applications, and Spring Boot applications are well-suited for microservices architectures. Spring Boot’s lightweight and modular nature allows developers to create containerized microservices easily, and Kubernetes provides an excellent platform for orchestrating and scaling these services.
The Timeline of the Java Spring Boot Application Migration
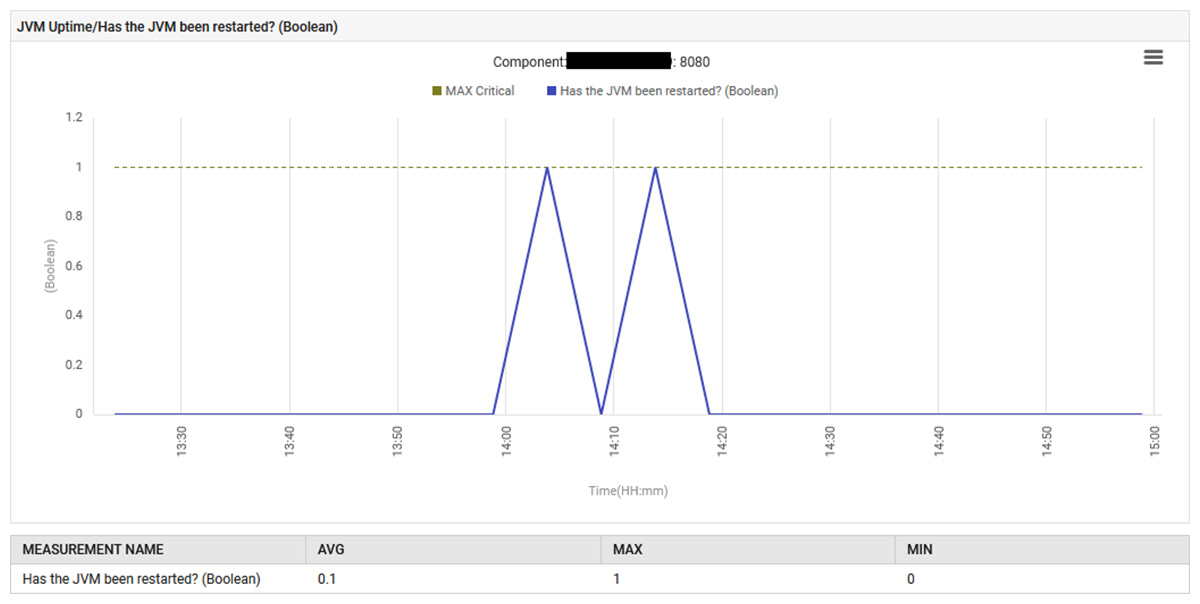
On August 6th at 14:13, The application was restarted with a new Spring Boot jar file containing an embedded Tomcat.
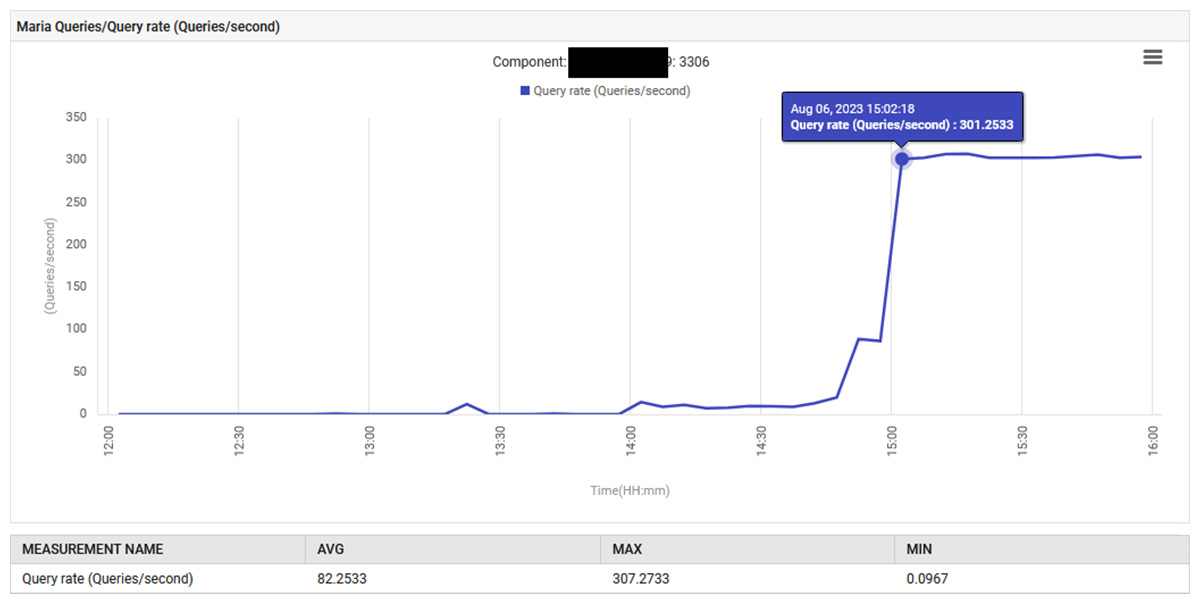
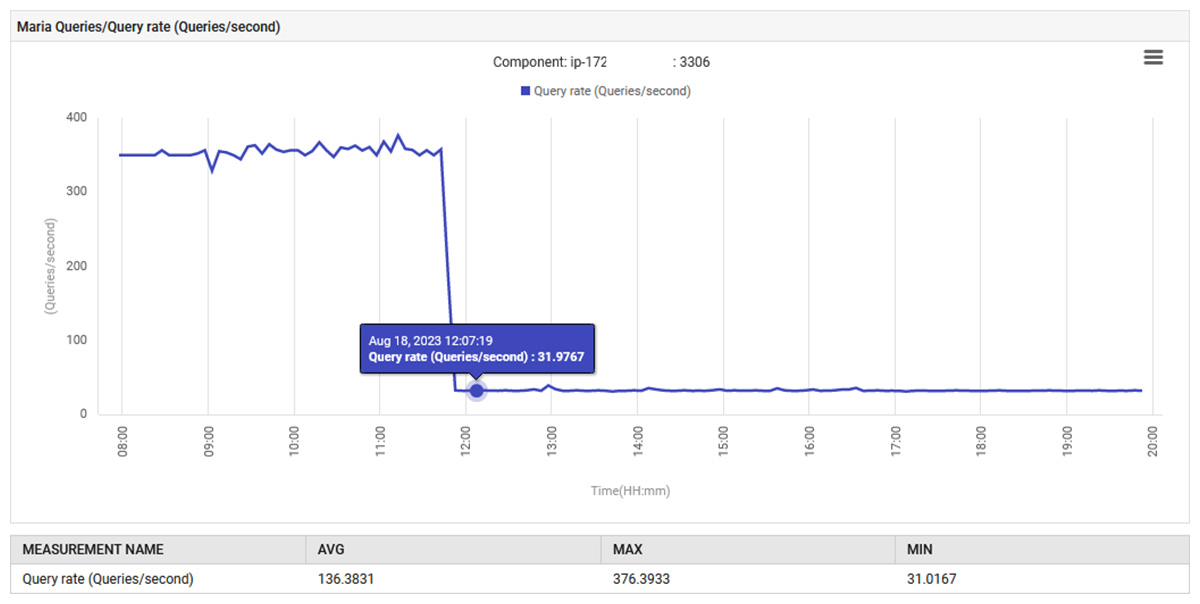
At 14:52, the query processing rate for MariaDB increased from 0.1 to 88 queries per second and then to 301 queries per second.
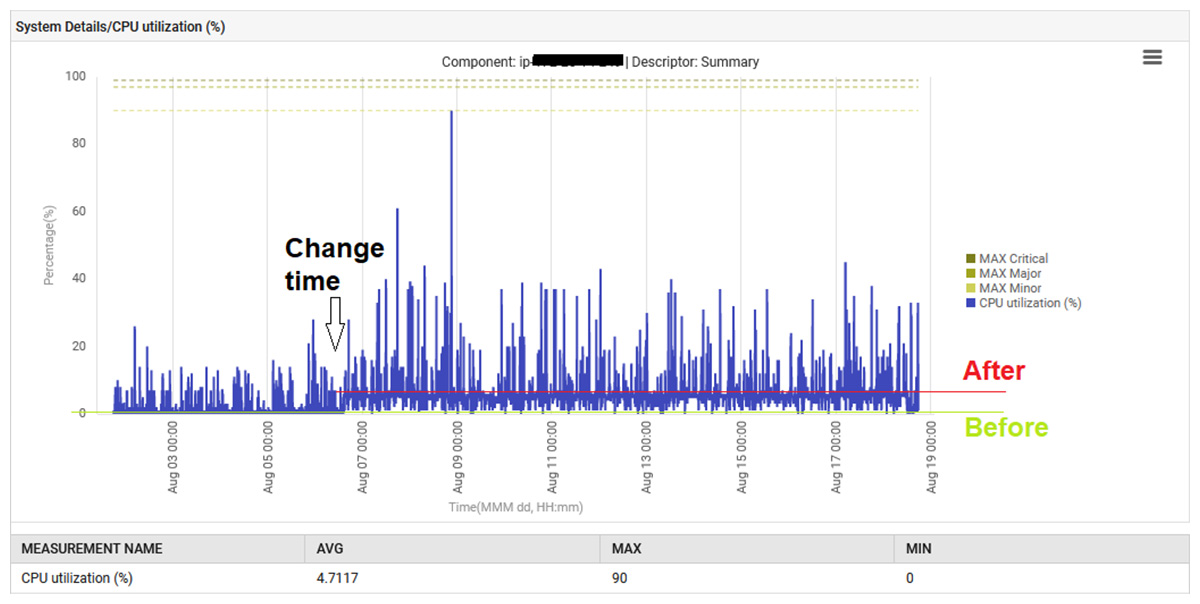
Additionally, the system CPU was elevated from 1% to 6%.
Finally, the JVM time spent on the G1 Young Generation Garbage Collection increased from 0% to 0.1% and remained at that level.
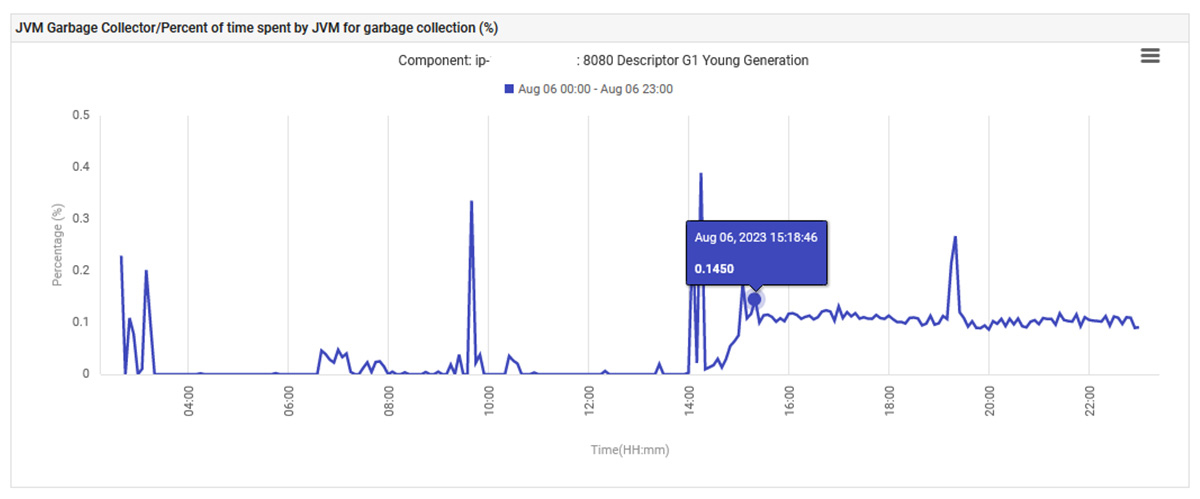
The application, in its UAT phase, was behaving abnormally and issuing 300 queries/sec, which is far beyond what it was designed to do. The new feature caused an increase in database connections, which is why the increase in queries is so dramatic.
The monitoring dashboards also showed that the problematic metrics had been normal before the new version was deployed.
The Resolution of the Spring Boot Problems
What is JPA?
JPA (Java Persistence API) is a Java-based specification and API for managing relational data in applications using Java. JPA provides a set of interfaces and standard annotations that allow Java developers to interact with relational databases in a way that is both portable and easy to use.
The application is a Spring Boot application that uses JPA to query a MariaDB. The application is designed to run on two containers when experiencing a minimal load but is expected to scale up to ten under peak demand.

Logical questions naturally arise – If a single container can generate 300 queries per second, can the stack handle 3000 queries per second if all ten containers are operational? Will the database have enough connections to meet the needs of the other parts of the application?
At this point we investigated the changes committed by the developer in Git. The changes were relatively minor and added simple functionality to take a few records from a table and process them. However, this is what we observed in the service class.
List findAll = this.xRepository.findAll();
The unqualified use of a findAll() method without pagination in Spring’s CrudRepository which is not efficient. Most basic RDBMS tutorials cover this – like the use of WHERE in SQL, it is more efficient to request a subset of records by certain criteria than request all records and process them on similar criteria. Pagination helps to reduce the amount of time it takes to retrieve data from the database by limiting the amount of data fetched. Additionally, pagination helps to keep memory usage low to prevent the application from crashing due to an overload of data, as well as reducing the Garbage Collection effort of Java Virtual Machine, which was mentioned in the problem statement above.
This test was conducted using only 2,000 records in one container. If this code were to move to production, where there are around 200,000 records in up to 10 containers, it could have caused the team a lot of stress and worry that day.
The application was rebuilt with the addition of a “By” clause, which is equivalent to the role of a WHERE clause in SQL, to the method.
List findAll = this.xRepository.findAllByY(Y);
After making this change and redeploying the application, normal behavior was restored. The number of queries per second decreased from 300 to 30, and the amount of effort put into garbage collection returned to its original level. Additionally, the system’s CPU usage decreased.
Improving and Tuning Observability and Monitoring for Pre-Production Testing with eG Enterprise
In this case, having observability expertise involved in reviewing the data overviews quickly identified the issues. Incidents like this one empower organizations to iterate and refine their monitoring during testing to automate issue diagnostics further.
In this case the UAT tests did not realistically reflect the production environment usage and scalability expectations. Long-term the customer will refine their test coverage.
The test system and the associated metric thresholds used for eG Enterprise alerting were out-of-the-box designed for the customers’ production systems and naturally did not trigger with a CPU usage of 6%. Experienced users can however tune such thresholds to leverage auto-baselining whereby the AIOps engine and machine learning technologies establish the normal behavior of a system and raise alerts automatically when anomalies occur. In this case the customer may wish to tune their thresholds during such testing to raise alerts when infrastructure resources such as CPU deviate by 200% of established behavior. Information on leveraging eG Enterprise’s powerful auto-baselining and anomaly detection is covered in: White Paper | Make IT Service Monitoring Simple & Proactive with AIOps Powered Intelligent Thresholding & Alerting (eginnovations.com).
The code changes were known to be minor and limited to Git check-ins by a single developer and so the customer sourced the coding issues directly from Git. In many scenarios though a new version of an application will integrate hundreds of changes from multiple developers within multiple Java methods and diagnosing the exact method that is the root-cause of the issue will be a tedious and often manual task. In such scenarios, the full stack DevOps monitoring capability of eG Enterprise can be leveraged to identify exact method call that is causing slowness. eG Innovations brings DevOps monitoring under a unified console so that the administrator has full visibility of the roll-out process. eG Enterprise supports important components of the CI-CD pipeline such as GitHub, JenKins, Docker, K8s, BitBucket, RedHat Ansible Tower, Jira etc. See: Identifying and Diagnosing a CPU Issue in the JVM (eginnovations.com) and Java Code Level Visibility | eG Innovations.
Learning and Summary
Anyone who works in Site Reliability Engineering (SRE) will appreciate the significance of this discovery. We were able to act upon it without having to raise a Severity 1 flag. Without the pre-production troubleshooting of this flawed Spring Boot package, in production it could have triggered the customer’s auto-scaling threshold, resulting in new containers being launched even without any additional user load.
There are three main takeaways from this story.
- Firstly, it is best practice to turn on an observability solution from the beginning, as it can provide a history of events that can be used to identify potential issues. Without this history, it could have been easy to overlook that a 0.1% Garbage Collection percentage and 6% CPU consumption showed a serious issue, and the code could have been released into production with disastrous consequences. Expanding the scope of the monitoring solution to their UAT servers helped this team to identify potential root causes and prevent problems before they could impact the live service and business.
- Secondly, performance-related test cases should exist in the testing process, and these should be reviewed by someone with experience in observability. This will ensure the functionality of the code is tested, as well as its performance.
- Thirdly, cloud-native performance tracking techniques are good for receiving alerts about high utilization, availability, etc. To achieve observability, you also need to have the right tools and expertise in place. Happy Coding!
This article expands on an article that I recently wrote on DZone, see: Shift-Left Monitoring Approach for Cloud Apps in Containers – DZone.
eG Enterprise is an Observability solution for Modern IT. Monitor digital workspaces,
web applications, SaaS services, cloud and containers from a single pane of glass.
Learn more
- In this case high CPU because of GC behavior was observed, my colleague has written some very insightful articles on the subtleties of Java GC behavior and how issues may manifest themselves in both testing and production environments, see: What is Garbage Collection in Java: Detailed Guide and Java Memory Leak: 7 Myths that SREs Need to Know.
- Learn more about the roles of APM and load testing when testing Java apps in: How APM Solutions Enhance JMeter Load Testing Visibility (eginnovations.com).
- Failing to use production-like test environments is common and my colleague covers this and other important test considerations SREs often must communicate with management (for getting budget) in Java Memory Leak: 7 Myths that SREs Need to Know (eginnovations.com).
- eG Enterprise supports the monitoring of key CI/CD technologies – see: Top DevOps Tools | eG Innovations.
 Pandian Ramaiah is a Technical Consultant based in the eG Innovations’ Singapore office. He works with customers across the APAC region providing technical advice and solution architectures to implement modern observability across a wide range of technologies including APM, infrastructure and databases.