SREs need smarter Java exception monitoring for modern applications
It’s 2 a.m. Alerts flood your dashboard. Transactions are failing, but logs offer no clues. Your SRE team is drowning in noise—while users struggle with outages.
As Java workloads shift to microservices, Kubernetes, and the cloud, this problem is compounded. Exceptions cascade across tiers, triggering blame games while the root cause remains buried under fragmented logs and scattered alerts.
Legacy monitoring tools overwhelm SREs with raw data but fail to connect the dots. Microservices failures slip through, transient errors disappear before debugging, and cascading failures spread unpredictably.
In this article, I’ll highlight seven important Java exception monitoring blind spots that slow down issue resolution. You’ll see how full-stack observability helps detect cascading failures and pinpoint root causes faster.
In the first part of this blog series, Part 1: Exception Monitoring in Java – A Guide to Handling Java Exceptions, I covered the fundamentals: common causes of Java exceptions, the differences between exceptions and errors, and best practices for handling them.
Before diving into the top blind spots, let’s look at the key challenges SREs face in Java exception monitoring.
Java Exception Monitoring is Broken—Here’s Why SREs Struggle
 #1: No source code access: SREs managing third-party applications like core banking systems often lack source code access, making traditional monitoring ineffective. Without built-in observability, they rely on log-based debugging, which is manual, error-prone, and incomplete.
 #2: Simultaneous JVM issues that cascade: In complex environments, multiple JVMs often span diverse tiers, each handling different application components or services. When exceptions arise, they can cascade across JVMs, complicating the tracing of root causes. For example, an exception in a database connection pool might trigger errors in upstream services, flooding logs with seemingly unrelated failures.
 #3: Point solutions lack visibility: Traditional developer tools are designed with a narrow scope, focusing on debugging or optimizing specific parts of an application. While they excel in analyzing isolated code snippets or single JVMs, they often lack cross-application visibility, making them insufficient for SREs troubleshooting large-scale environments.
 #4: SREs need tools that go from macro to micro: Effective exception monitoring begins at the system-wide level, much like a general physical examination before diagnosing specific symptoms. SREs need tools that provide a high-level health check to quickly triage issues without waking the entire team at 2 a.m.
Once SREs identify the affected subsystem, they can zoom in on the root cause, tracing exceptions down to specific JVMs, services, or even lines of code. This layered approach ensures faster resolution by filtering noise and directing focus where it matters most.
Modern microservices and cloud architectures make Java exception monitoring complex
Exceptions were simpler to track in monolithic applications. Failures stayed within a single JVM.
In modern microservices architectures, failures start anywhere in the execution chain. Java exceptions in downstream services and third-party APIs cascade across services and flow upstream. Exception handling may also be inconsistent. Different services use varied try/catch strategies and response formats.
Auto-scaling may sometimes have unintended consequences. Orchestration tools such as Kubernetes interpret exception-driven crashes as load spikes, auto-scaling the deployment of flawed containers that replicate the same exceptions cluster-wide.
Fortunately, APM and observability tools can trace invocations and Java exceptions across service boundaries using trace ID propagation (i.e. tag-and-follow) without needing any code changes via Java bytecode instrumentation.
Now that we’ve outlined the context around core challenges that SREs face, let’s examine the most critical Java exception monitoring blind spots that hinder issue resolution.
Blind Spot #1: Critical Java exceptions are buried in noise. How do you know what to fix first?
SREs need to distinguish between routine exceptions and those that pose significant risks to system performance and reliability. Robust monitoring is key to identifying which Java exceptions demand immediate attention and which are just noise.
Severity vs. Frequency
 High Severity: Some exceptions crash your system. Others clog your logs. Can you tell the difference? Look for infrequent but highly critical exceptions, such as an OutOfMemoryError, which can have catastrophic consequences if not resolved immediately.
 High Frequency: Pay close attention to exceptions that occur frequently. While they might not seem critical on their own, their repeated occurrence can signal underlying systemic issues. For example, a recurring ConcurrentModificationException during Java thread execution might point to synchronization or state management problems that could escalate if left unaddressed.
It’s equally important for SREs to differentiate between exceptions and errors. Errors often result in crashes or critical failures, demanding immediate attention and resolution. Exceptions, on the other hand, may indicate recoverable issues or warning signs. For a deeper understanding of this distinction, refer to Part 1: Exception Monitoring in Java – A Guide to Handling Java Exceptions of this blog series.
Effective troubleshooting relies on identifying the fully qualified class name (e.g., com.easykart.shoppingcart.UnableToAddItemToCartException). This level of granularity enables teams to locate root causes efficiently and assign them to the appropriate microservice team. Comprehensive Java exception monitoring ensures visibility at this level, making root cause analysis faster and more precise.
Observability tools must provide immediate insights to help SREs take action from day one.
Here’s an example of how eG Enterprise delivers on this promise:
- Out-of-the-box capabilities: eG Enterprise offers an opinionated list of high-severity exceptions, such as java.lang.OutOfMemoryError, enabling immediate prioritization with no extensive customization. Learn more: Java Application Monitoring – How IT Ops can Diagnose Memory Leaks at Scale | eG Innovations.
- Customizable monitoring: Tailor monitoring with custom exceptions, such as com.bank.security.UnauthorizedAccessException, to meet your own domain-specific needs.
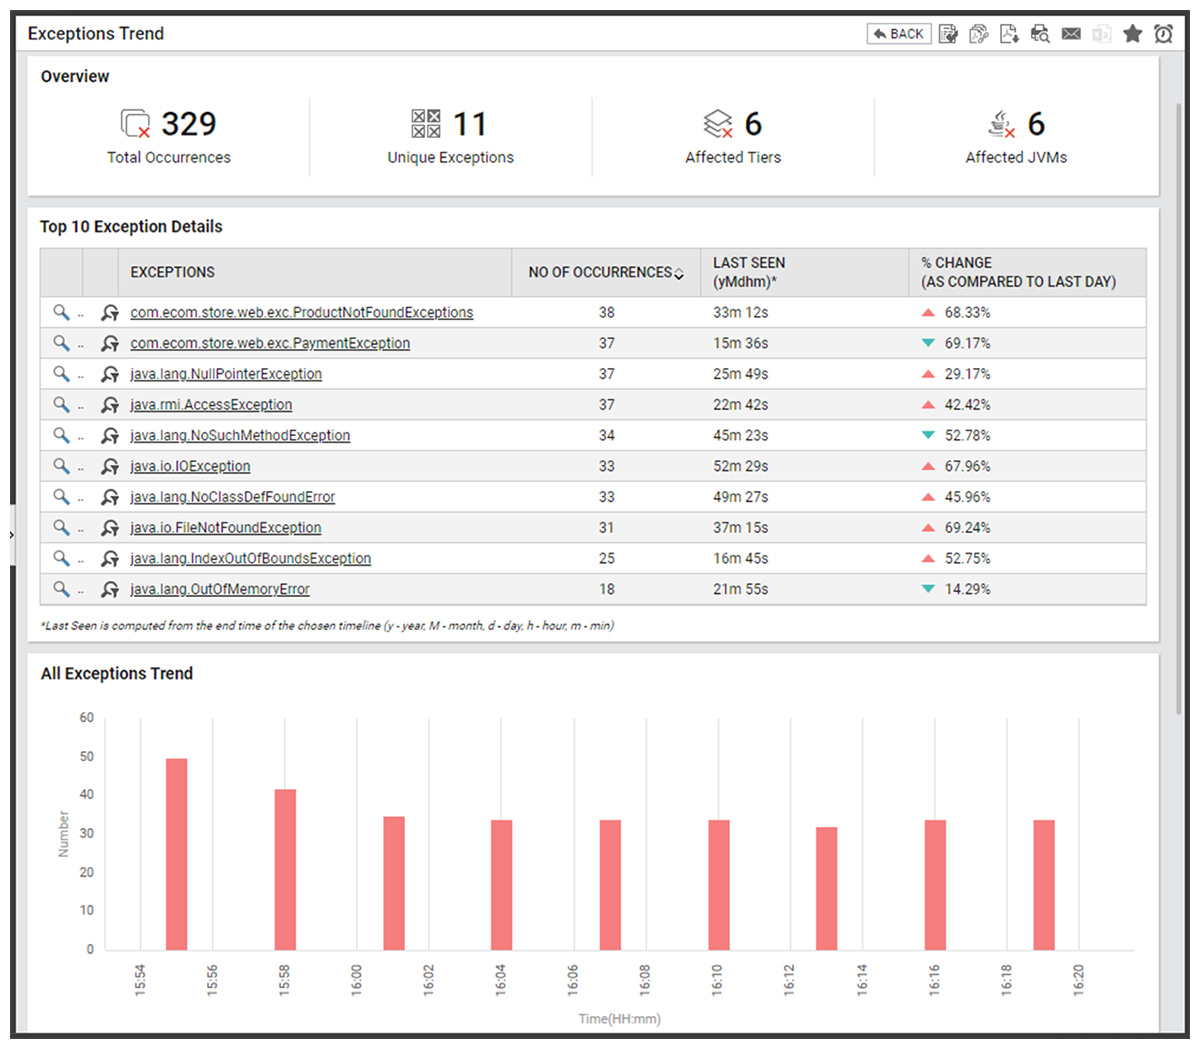
Key observability metrics and dashboards
- Fully-Qualified Class Name (FQCN) of the exception: Avoid confusion between similarly named exceptions. Using FQCN allows developers to precisely catch, and address issues based on their specific source or package. For example, instead of just mentioning IOException, its FQCN would be java.io.IOException.
- Number of Occurrences: Identify and prioritize exceptions that occur frequently, enabling targeted troubleshooting.
- Last Seen: Track the most recent instance of each exception to quickly identify active issues needing attention.
- Percentage Change: Monitor trends by comparing exception occurrences over time, spotting patterns or spikes.
- Total Exceptions: Highlight recurring exceptions that might signal deeper, systemic problems.
- Affected JVMs: Pinpoint JVMs experiencing frequent exceptions, focusing efforts where they’re most needed.
- Affected Tiers: Identify stressed system layers to better understand the broader impact of exceptions.
Figure 1 shows a real-time Java exception monitoring dashboard that helps SREs differentiate critical failures from routine exceptions. By tracking Java exceptions across tiers and JVMs, teams can prioritize issues, detect trends, and quickly pinpoint root causes before failures escalate.

Blind Spot #2: Your JVMs are failing, but you’re flying blind. Is it a one-off failure—or the start of a cascading outage?
SREs manage multiple applications running on diverse JVMs, each with its own challenges. Without holistic observability, they lack a unified view of exceptions across JVMs, making troubleshooting slow and fragmented.
Consider the following example from a banking system where the SRE has to operate in a “shared service” model overseeing multiple banking applications:
- Core Internet Banking: Manages online transactions and user interactions, encountering exceptions such as TimeoutException or AuthenticationFailureException, which directly impact customer experience.
- Branch Banking: Supports in-branch operations, where exceptions like PrinterConnectionException or ATMCommunicationError often arise due to localized hardware or network issues.
- Private Banking: Caters to high-value clients, handling exceptions such as PortfolioServiceException or WealthStatementException stemming from personalized services or highly specialized applications.
As you can see, each application has unique failure scenarios. Exceptions can arise simultaneously across multiple JVMs. Identifying the critical JVMs affected ensures SREs can prioritize the most impactful issues and maintain smooth operations across the banking ecosystem.
Tiers vs JVMs – what’s the difference?
Think of tiers as functional layers in an application, like a front-end tier, a cart service tier, or a payment tier. Each tier groups together related JVM components that handle a specific part of the application’s workflow.
On the other hand, JVMs are the runtime environments where these services actually execute. A single tier can have multiple JVMs running in parallel to handle incoming requests and scale as needed.
For example, the cart service tier may have five JVMs processing shopping cart actions, while the payment tier may have ten JVMs managing transactions.
Why is monitoring at the tier level critical? SREs can see broader patterns across JVMs (grouped by tier) and diagnose systemic issues, rather than getting lost in individual JVM troubleshooting.
SREs must identify which JVMs and tiers consistently encounter exceptions to address potential bottlenecks or configuration issues.
- Frequent Exceptions Across JVMs: Tracking exceptions across multiple JVMs helps SREs pinpoint localized problems, enabling them to resolve issues before they escalate into system-wide failures.
- Application-Specific Exceptions: Gaining visibility into which JVMs support specific applications allows SREs to focus on addressing service-specific challenges.
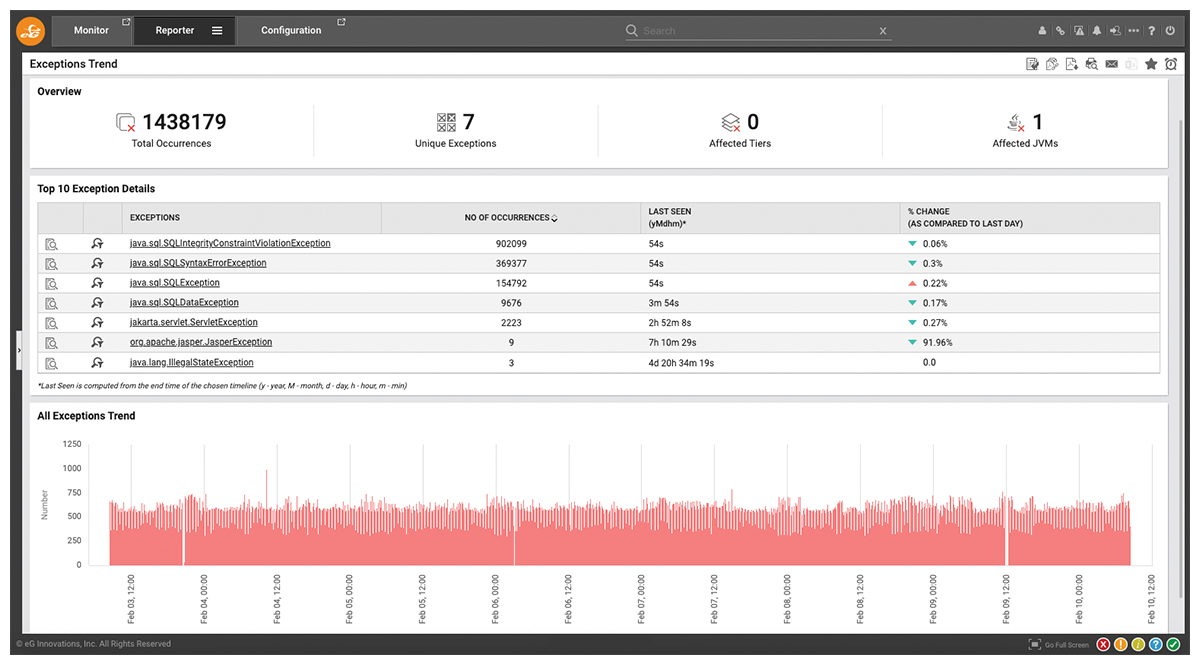
Key observability metrics and dashboards
For effective JVM- and tier-specific exception tracking, your dashboard should provide:
- JVM and Tier Identifiers: Pinpoint which JVMs and tiers are generating exceptions across multiple applications and system layers.
- Consistency of Exceptions: Monitor whether certain JVMs or tiers consistently encounter exceptions over time. Repeated exceptions may indicate localized configuration issues, resource constraints, or systemic patterns.
- Distribution of Exceptions: Analyze whether exceptions are spread across multiple JVMs and tiers or concentrated in specific instances. This insight helps determine if the issue is systemic or isolated.
- Application Name: Identify which applications are impacted by JVM- and tier-specific exceptions, enabling targeted troubleshooting efforts.
- Number of Exceptions: Track the total exceptions occurring within each JVM instance and tier to prioritize critical problem areas.
- Last Occurrence: Stay informed about when the latest exception was observed for each JVM and tier to address active issues promptly.
- Exception Frequency: Assess how frequently exceptions occur in specific JVMs or tiers to identify patterns and determine if further investigation is necessary.
The dashboard shown in Figure 2 helps SREs distinguish localized issues from system-wide failures. By analyzing total occurrences, unique exception types, and historical trends, teams can pinpoint persistent problem areas, detect performance bottlenecks, and prioritize fixes that have the greatest impact on system stability.
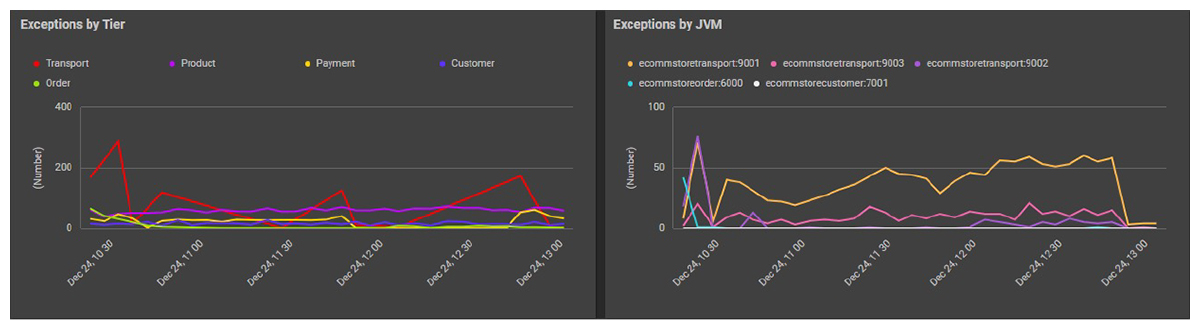
To effectively diagnose Java exceptions, SREs need to track trends across both tiers and JVMs. Identifying patterns at the tier level helps detect system-wide issues, while JVM-specific insights enable precise troubleshooting.
Figure 3 illustrates these perspectives: one graph highlights exceptions across functional tiers (e.g., transport, product, payment, customer), revealing system-wide trends, while the other zooms into JVM-specific exceptions, helping SREs pinpoint localized failures within microservices. Together, these insights form part of a holistic dashboard, enabling teams to detect patterns, diagnose root causes, and optimize system reliability.
Blind Spot #3: Critical transactions are failing, but Java exceptions aren’t mapped to business impact
Not all business transactions are created equal. Prioritizing high-value transactions is critical to minimizing business impact and ensuring smooth operations. Robust Java exception monitoring ensures that mission-critical transactions don’t slip through the cracks.
Here are some actionable steps:
- Identify and categorize high-value business transactions to prioritize monitoring efforts.
- Leverage Java exception monitoring tools to correlate exceptions with specific transactions and their impact.
- Focus on proactive detection of exceptions that affect critical business processes.
- Use insights from exception monitoring to communicate business impact clearly to stakeholders.
Key observability metrics and dashboards
Real-time business transaction monitoring gives SREs a clear view of transaction health—Healthy, Slow, Stalled, or Error—while directly linking transactions to Java exceptions and vice versa.
This two-way correlation helps teams focus on the most impactful issues and prioritize fixes effectively:
- Exceptions to Business Transactions: Identify which transactions (e.g., payments, checkout) are affected by specific exceptions like TimeoutException or NullPointerException. This ensures that critical failures receive immediate attention.
- Business Transactions to Exceptions: Trace high-priority transactions back to the exceptions they encounter, allowing microservice teams to zero in on the root cause and prevent recurring failures.
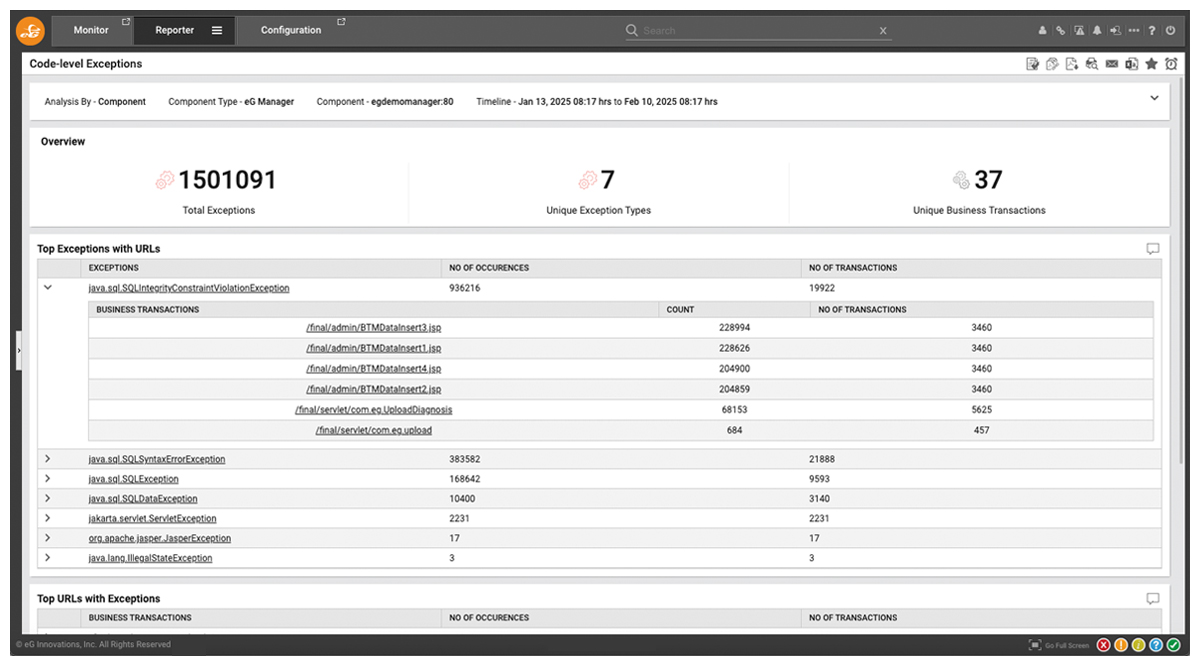
Figure 4 illustrates how Java exceptions correlate with business transactions, enabling SREs to pinpoint failures affecting critical operations. This visibility helps teams focus on high-impact issues, optimize troubleshooting, and minimize disruptions to essential workflows.
Advanced slice-and-dice for Java exception monitoring
Effective exception monitoring requires moving beyond aggregated data to deliver actionable insights. Advanced filtering capabilities empower SREs teams to:
- Refine exception analysis by impacted usernames, error status, and business transactions.
- Pinpoint critical issues by filtering URLs, client IP addresses, and specific exceptions.
- Slice-and-dice filters across dimensions to uncover hidden patterns and root causes.
- Accelerate investigation and resolution by narrowing down exceptions using precise criteria.
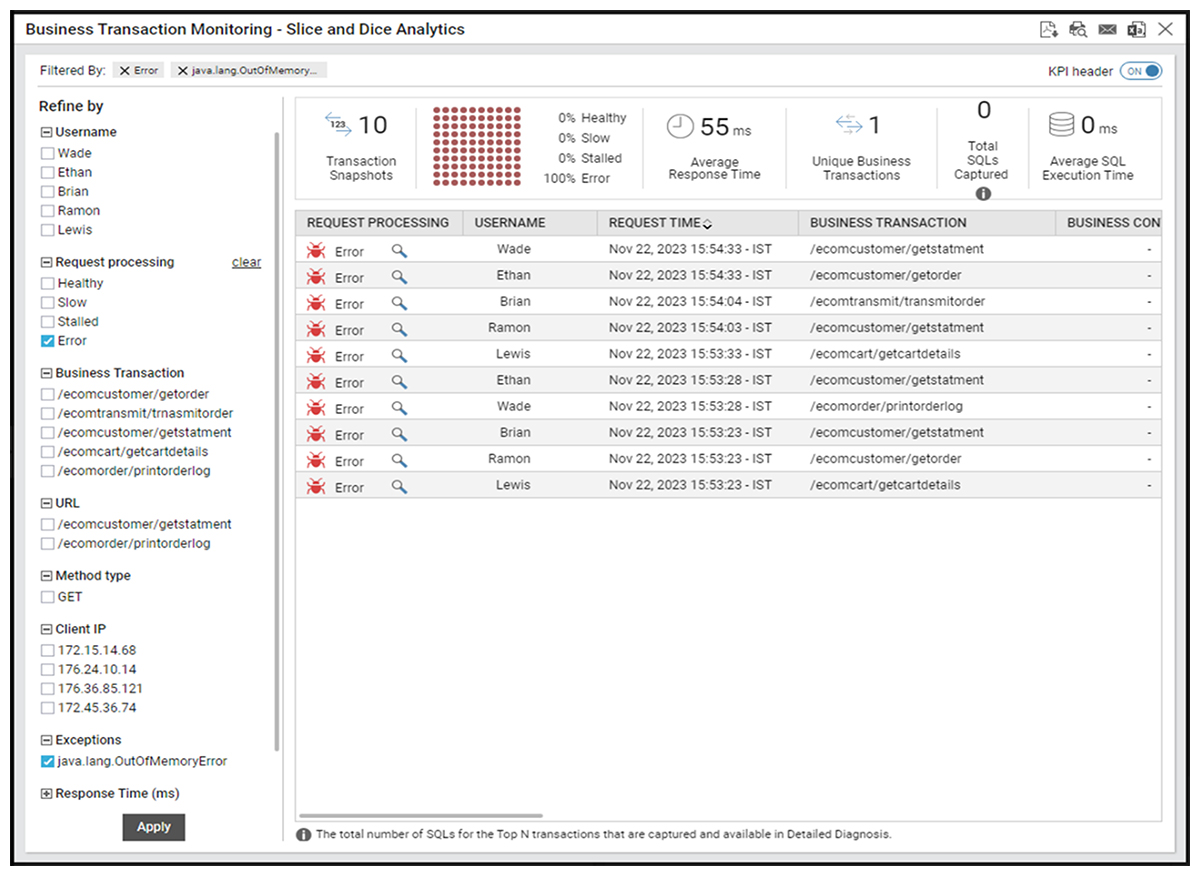
Figure 5 demonstrates how advanced filtering helps SREs analyze Java exceptions with greater accuracy. By segmenting exceptions based on business transactions, client IPs, usernames, and exception types, teams can uncover hidden trends, quickly diagnose failures, and focus on resolving issues that disrupt critical business processes.
Blind Spot #4: Downstream Java exceptions are disrupting upstream services, but you can’t pinpoint the source
In complex microservices architectures, diagnosing root causes in microservices requires SREs to have clear visibility into how exceptions propagate across tiers. With this capability, SREs can correlate exceptions between upstream and downstream components, uncovering the true source of failures rather than chasing symptoms.
In distributed systems, exceptions often cascade from one tier to another, causing widespread disruptions.
Here are some examples:
- Downstream Databases: A database timeout can lead to upstream services failing due to unavailable data.
- Downstream JVMs: Failures in dependent microservices may manifest as exceptions in unrelated services.
- Cross-Service Dependencies: Interconnected microservices can escalate minor issues into critical, system-wide failures.
Without exception correlation, SREs end up fixing symptoms instead of root causes, leading to repeated failures and extended outages.
Key observability metrics and dashboards
To effectively analyze exceptions across tiers, your dashboard should provide the following insights:
- Correlation Between Tiers: Identify how exceptions in one tier (e.g., databases or downstream JVMs) propagate to other tiers (e.g., APIs or user-facing services).
-
Dependency Mapping: Visualize service dependencies to trace the flow of exceptions and pinpoint choke points effectively.
-
Systemic Patterns: Detect recurring failure chains, such as repeated timeouts between specific microservices, to uncover potential architectural flaws.
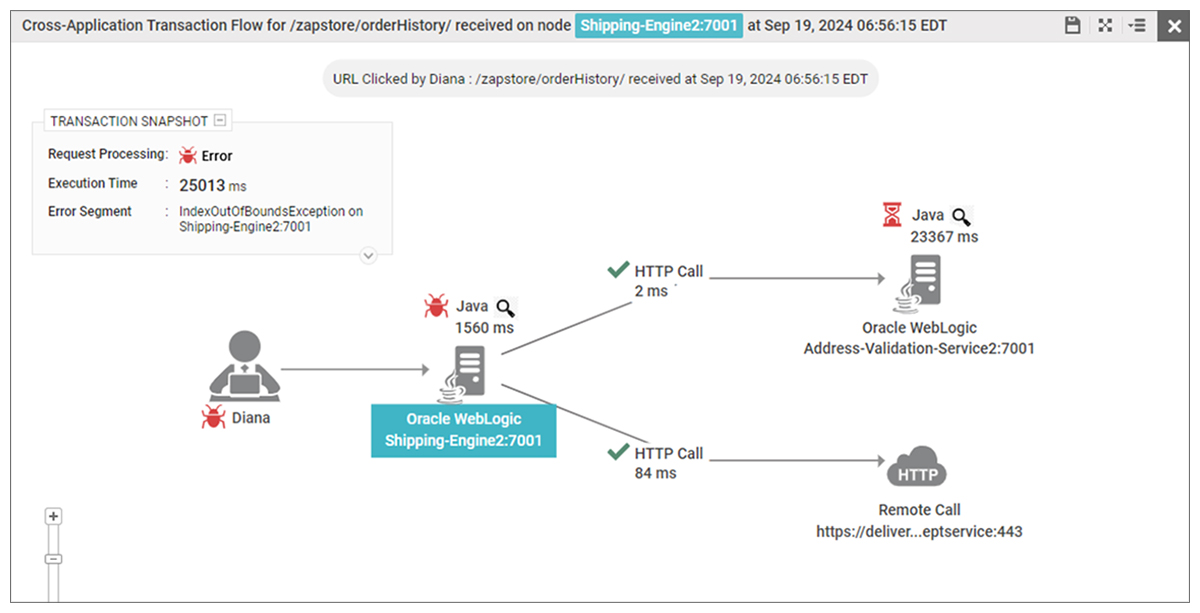
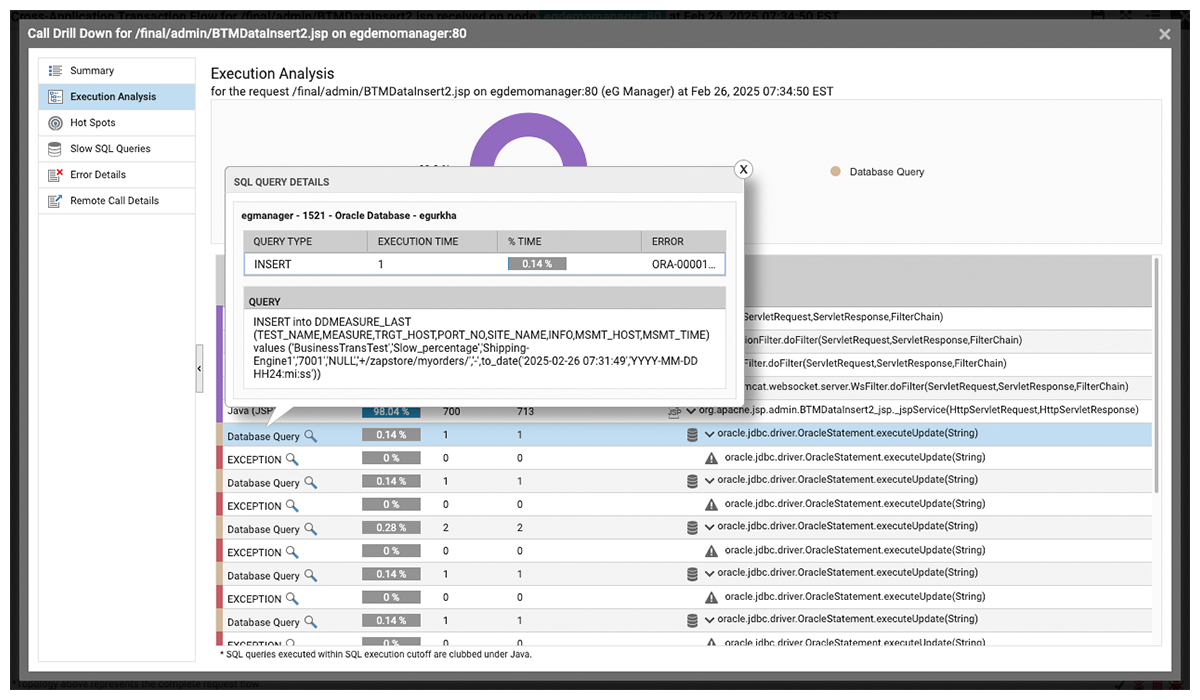
As Figure 6 shows, when an exception occurs in a microservices-based Java application, it can cascade across services, impacting transactions. Transaction tracing helps pinpoint the root cause, enabling faster diagnosis and resolution.
The good news is that SREs can get the above visibility with zero code changes using APM tools that use Java bytecode instrumentation. Here’s what transaction tracing in Java exception monitoring reveals:
- Exception Propagation Path: Visualize how exceptions flow across tiers or microservices, revealing the cascading impact on the system.
- Affected Tiers and Services: Identify which tiers or services are impacted by cascading failures, enabling SREs to prioritize critical areas.
- Dependency Links: Understand the connections between services and components to trace how failures propagate across the architecture.
- Root Cause Insights: Pinpoint the initial point of failure to focus efforts on addressing the true source of the issue.
Tracing Exceptions Across Microservices for Faster Root Cause Analysis
Traditional logging lacks the ability to connect the dots between service dependencies, making it difficult to identify root causes of cascading failures or performance bottlenecks in a distributed system.
eG Enterprise’s distributed tracing capabilities enable SREs to monitor application performance and understand how exceptions impact user experience. By drilling into transaction traces, SREs can analyze individual user journeys and identify specific transactions that may have triggered an exception.
Blind Spot #5: You can’t reliably trace Java exceptions to their exact line-of-code
For SREs managing complex systems, the ability to triage exceptions to the right microservice team is critical, especially in cascading failure scenarios. Without this capability, teams risk spending critical time at 2 a.m. chasing symptoms rather than addressing the true root cause, leading to prolonged downtime, frustrated users, and unnecessary operational overhead.
Key observability metrics and dashboards
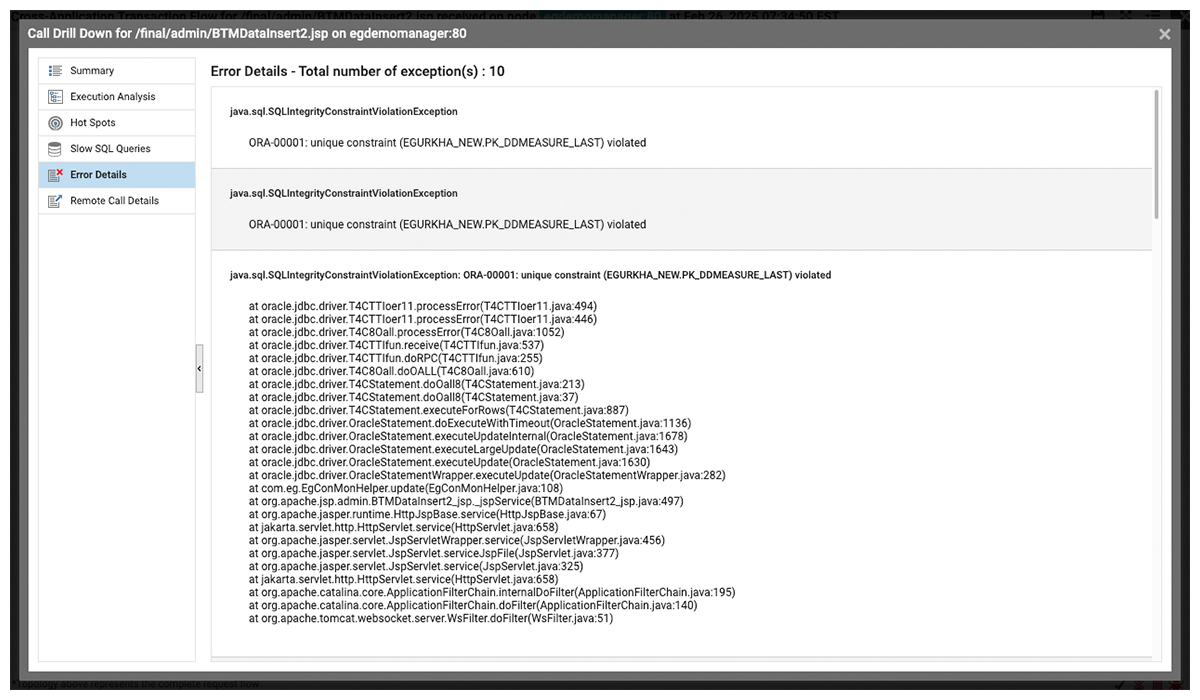
When Java exceptions occur, pinpointing their exact execution path is crucial for diagnosing and resolving failures. Without line-of-code visibility, SREs risk spending hours chasing symptoms rather than addressing the root cause. Stack traces provide a clear execution path, revealing the sequence of method calls leading to an exception and helping teams quickly identify and fix underlying issues.
Another key capability is tracking and analyzing HTTP status codes (200, 300, 400, and 500) alongside Java exceptions. This enables SREs to correlate failed requests, unauthorized access attempts, and server-side errors with underlying application issues, ensuring faster diagnostics and resolution.

Blind Spot #6: Server-side Java exceptions are frustrating users, but you can’t see the impact
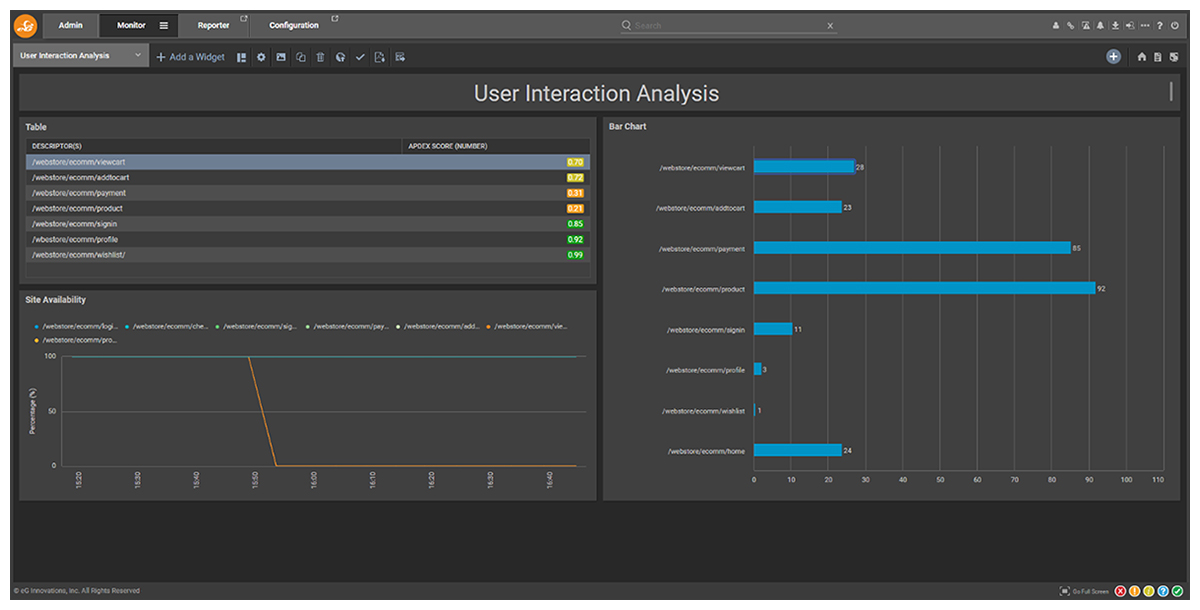
Understanding how backend failures affect user experience is critical for improving satisfaction. By correlating server-side exceptions with Apdex scores captured through real user monitoring, SREs can collaborate with business teams to prioritize fixes that maximize user satisfaction and business outcomes.real user monitoring,
Apdex (Application Performance Index) quantifies user satisfaction by measuring the ratio of satisfactory, tolerable, and frustrating response times, providing an objective measure of how performance affects user experience. Think of Apdex as a Service Level Agreement (SLA) mechanism that measures the level of user satisfaction (or frustration).
A unified dashboard combining backend exception data with user satisfaction metrics (e.g., Apdex) highlights direct correlations between backend failures and user frustration, helping SREs prioritize fixes that restore service reliability.
Modern observability tools like eG Enterprise bridge frontend and backend monitoring by correlating browser-side errors with backend exceptions. This end-to-end visibility helps SREs pinpoint root causes faster and minimize user impact.
How Server-Side Exceptions Impact User Satisfaction
- Increased Response Times: Exceptions delay requests, reducing Apdex scores and frustrating users.
- Frustrated Users: Frequent errors erode user trust, leading to lower engagement and retention.
- Reduced Functionality: Unhandled exceptions block transactions or workflows, impacting revenue.
- Degraded Performance: A high volume of exceptions overloads infrastructure, causing widespread slowdowns.
Key observability metrics and dashboards
Server-side exceptions don’t just degrade system performance—they directly impact user experience. Backend failures lead to slowdowns, transaction errors, and downtime, eroding user trust. By correlating backend exceptions with Apdex scores, SREs can quantify performance issues’ effect on satisfaction and focus on the most impactful fixes.
Blind Spot #7: Java exceptions are disrupting users, but you don’t know who’s impacted
Identifying users affected by Java exceptions is essential for SRE teams, especially in CRM, ERP, and high-value customer applications. For example, in private banking applications, catching exceptions affecting platinum clients early helps prevent churn and maintain customer trust.
This visibility helps SREs align technical troubleshooting with business priorities, enabling proactive user engagement and faster issue resolution.
eG Enterprise leverages user tagging and name capture to pinpoint affected individuals, allowing organizations to prioritize and resolve issues for their most valuable customers.
Key observability metrics and dashboards
By linking usernames through real user monitoring and server-side correlation, SREs can visualize affected users in a slice-and-dice dashboard.
The dashboard provides direct visibility into usernames, enabling filtering, transaction tracking, and root cause analysis.
- Username: The impacted user’s username, captured via real user monitoring, helps SREs identify affected individuals and prioritize troubleshooting.
- IP Address: The IP address helps SREs determine the network origin of impacted users. eG Enterprise also captures X-Forwarded-For headers to track users behind proxies or load balancers.
- Business Transaction URL: The transaction URL pinpoints where failures occurred in the user journey, enabling faster root cause analysis and resolution.
- Health State: The health state (Healthy, Slow, Stalled, or Error) reflects the user experience at failure points, helping SREs prioritize urgent issues.
When Java exceptions impact users, SREs need visibility beyond logs—they must identify which users were affected, what transactions failed, and how performance issues unfolded. Without this insight, troubleshooting remains reactive, leaving critical customer-facing problems unresolved.
Figure 10 shows how a slice-and-dice dashboard enables SREs to filter and analyze impacted users in real-time, linking exceptions to specific transactions and performance issues. By capturing usernames, IPs, transaction URLs, and health states, observability tools like eG Enterprise allow teams to proactively detect patterns, prioritize high-value customers, and enhance user experience.
Your applications are modernizing and your monitoring should too
Microservices, Kubernetes, and auto-scaling have transformed how Java applications run—but they’ve also made exception monitoring exponentially harder. Failures now cascade unpredictably across services, making troubleshooting like chasing shadows without deep visibility.
Exception monitoring designed for monolithic systems wasn’t built for cloud-native scale. Without modern visibility, failures go unnoticed, fixes take longer, and users pay the price.
Take control of Java exceptions before they take down your system
Advanced observability goes beyond logs. It connects exceptions, transactions, and user impact—so you can detect, diagnose, and resolve failures before they escalate.
- Pinpoint root causes instantly across JVMs, microservices, and auto-scaling environments.
- Correlate exceptions with business impact to prioritize the failures that truly matter.
- Detect cascading failures in real time before they spiral out of control.
eG Enterprise is built for SREs managing modern applications. With deep JVM insights and full-stack observability, it cuts through the noise, links failures to impact, and pinpoints root causes—no source code access required.
How eG Innovations can help
Here’s what you get with eG Enterprise’s comprehensive exception monitoring capabilities:
- Granular Exception Tracking and Analysis
- Slice-and-Dice Analytics: Filter and drill down into specific errors across JVMs, pinpointing issues by username, request processing status, and business transactions.
- Detailed Error Logs: Comprehensive logs trace exceptions down to the specific line of code and method, providing rich context for resolution.
- Comprehensive Business Transaction Monitoring
- User-Specific Monitoring: Tracks request details per user, offering insights into how specific JVM exceptions impact user experiences, enabling targeted resolution.
- Real-Time Transaction Insights: Monitors transaction statuses (Healthy, Slow, Stalled, Error) in real-time for immediate action on performance degradations.
- Holistic JVM Exception Trends
- Exception Trend Analysis: Visualizes JVM exception trends over time, helping prioritize escalating issues for faster resolution.
- Top 10 Exception Details: Highlights the most frequent and critical exceptions across JVMs, focusing attention on high-impact problems.
- Multi-Layered Performance Insights
- Layer Page Overview: Aggregates data from application, network, and other layers to provide a complete view of JVM performance, streamlining root cause analysis.
- Cross-Layer Correlation: Identifies how issues in one layer (e.g., network) influence another (e.g., application transactions), simplifying multi-layered troubleshooting.
- Context-Aware Exception Management
- Filter by Business Impact: Categorize exceptions by their effect on business transactions, prioritizing customer-critical issues.
- Application and JVM Context: Offers detailed insights into the specific JVMs and applications impacted by errors, supporting effective prioritization and resource allocation.

Stop firefighting. Get real-time exception insights built for modern Java applications.
Take control of Java exceptions before they impact users. Request a demo and eliminate Java exception blind spots today.
eG Enterprise is an Observability solution for Modern IT. Monitor digital workspaces,
web applications, SaaS services, cloud and containers from a single pane of glass.
 Arun is Head of Products, Container & Cloud Performance Monitoring at eG Innovations. Over a 20+ year career, Arun has worked in roles including development, architecture and ops across multiple verticals such as banking, e-commerce and telco. An early adopter of APM products since the mid 2000s, his focus has predominantly been on performance tuning and monitoring of large-scale distributed applications.