I recently worked on a customer project to migrate an in-house application to the cloud, using a shift-left monitoring and testing strategy. The original application was developed with LAMP architecture and was being migrated to Spring Boot to modernize it and then run it on the cloud. I was fortunate to be part of the conversation during the day-0 talks. Not all IT managers do this. Many of the meeting rooms for day-0 discussions do not provide a seat for observability engineering, as if it is something that will be dealt with on day-2.
We suggested the team onboard eG Enterprise from day-1. The outcome was impressive, the load testing applications combined with the observability solution revealed all the application bottlenecks during the stress and load testing phases. The load testing tools measured the response time, while the observability tools identified the root cause. This enabled the client to identify and address any potential performance issues before production deployment.
What is Shift-Left Monitoring?
Shift-left monitoring is a practice of integrating monitoring and testing early in the software development process. It helps identify issues, such as defects and performance problems, before deployment, improving software quality, reducing costs, and enhancing collaboration between development and operations teams.
Shift-left Requires a Strategic Approach Towards Observability
There is a pressing need for improved monitoring especially when migrating applications to the cloud. The monitoring industry is like a library full of books of varying genres. Some specialize in databases, others in cloud computing, apps, Dev-ops, or unified solutions. What is the most effective strategy to adopt? Gartner’s Magic Quadrant report for Application Performance Monitoring and Observability, covers how the best approach is to analyze multiple forms of telemetry data, such as traces, metrics, and logs, to identify and address any potential problems.
Indeed, on this project we leveraged all of the three pillars of observability – metrics, logs and traces. In brief:
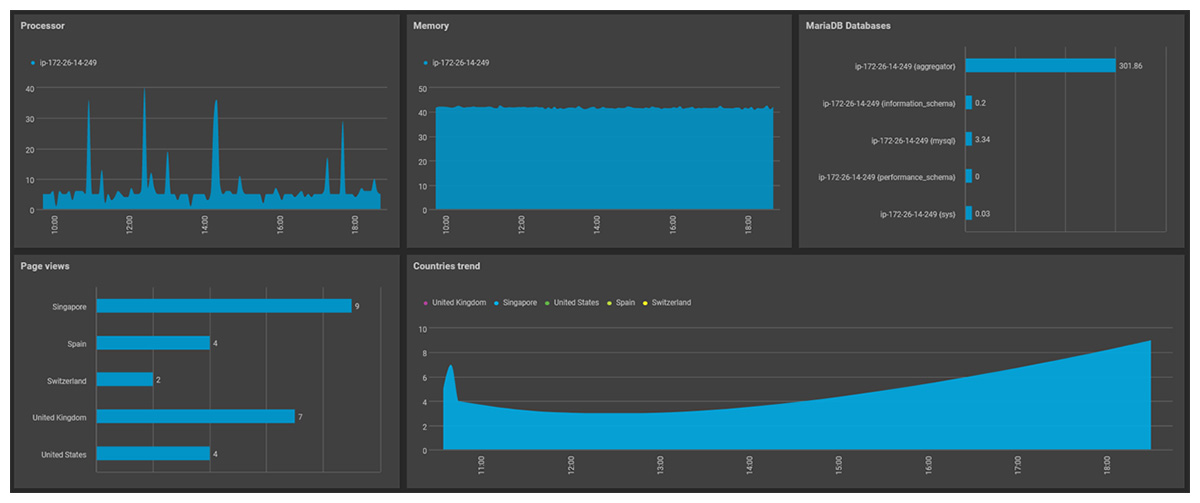
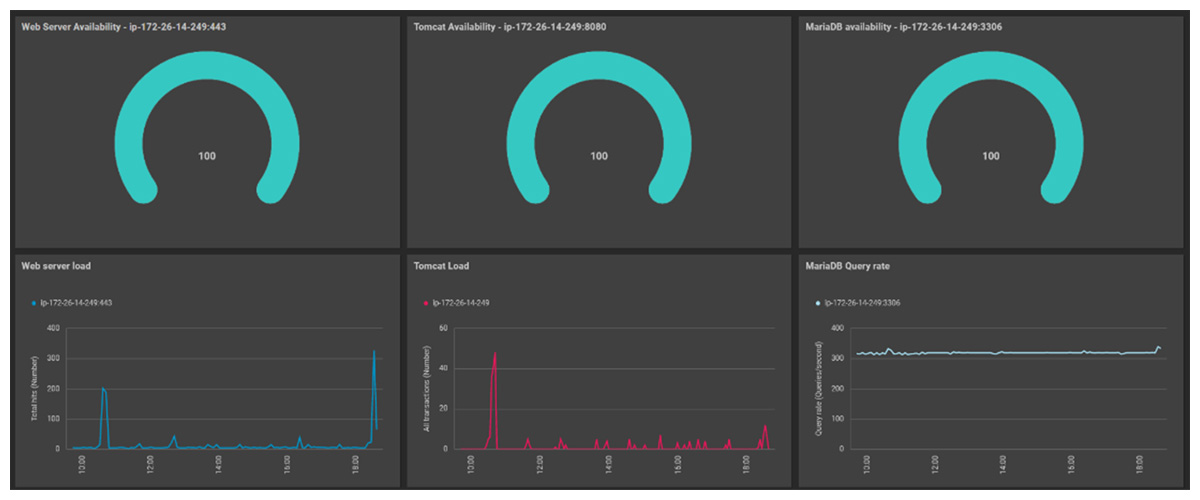
- Metrics: These are real time measurements like disk utilization, round trip time of the application, database growth rate, etc. They provide insights into the bottlenecks of the application.
- Traces: When we containerize the application, troubleshooting is no lesser challenge than isolating a single noodle from a Bee Hoon dish. It is important to visualize the flow of the application. On which server, in which app, in which class, in which method was the user request executed? What were the other apps, databases, messaging queues, and which third-party web services are used to deliver my user request? So, tracing the request flow path is also required.
- Logs: Analyzing logs like process logs, syslogs, event logs, SQL error logs are some of the telemetry end points to be monitored for an accurate problem isolation.
System Integrators (SIs) are often faced with the challenge of ensuring that their customers get the observability they require while using cloud-native tools. Unfortunately, this can sometimes lead to situations where SIs are only able to deliver basic CPU/Memory monitoring, leaving customers unsatisfied. This can result in conflicts and additional costs for SIs since they must bring on board experts to provide app and database support.
On my recent project, the client initially had thought that the cloud native tools (Azure Monitor / AWS Cloud Watch) would be helpful without realizing the scope of their capabilities. These tools are incredibly useful, as they provide the ability to monitor the resource utilization of the subscriptions from an infrastructure or capacity point of view. However, it is unrealistic to expect these tools to be able to cater to the needs of day-2 requirements of supporting an application running on the cloud.
Metrics and Shift-left Monitoring
Capturing the right metrics for each layer is essential for improved visibility across the tiers. To that end, KPIs (Key Performance Indicators) for web, app, and database servers were established, and performance dashboards provided to both the Operations Team and the Applications Team. A solution such as eG Enterprise that requires minimal effort in terms of auto-discovering servers and applications and monitoring KPIs without manual rules or configurations is recommended.
Traces and Shift-left Monitoring
Traces are an essential component of our observability goals. At any given moment, the operations team has visibility into the user experience. They can answer questions such as:
- How many users are currently using the application?
- How many of these users are satisfied with their experience?
- What is the source of dissatisfaction for unhappy users?
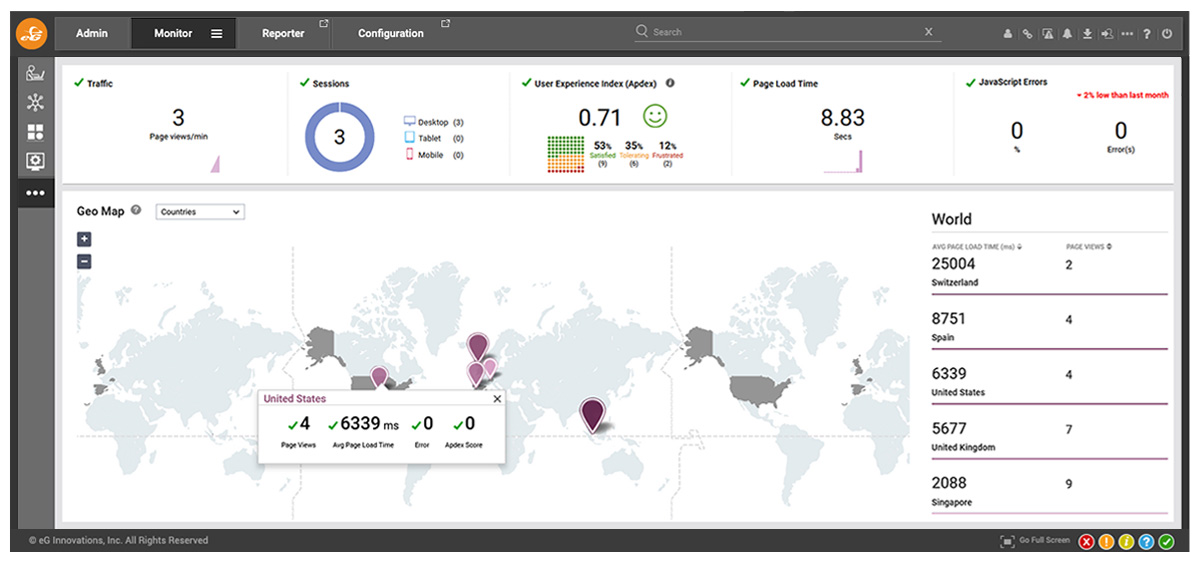
In LAMP application migration, one of the transactions was taking an excessive amount of time on the user side. The Real User Monitor identified the source of the delay; it was not on the server side but rather from third party content that the site relies on. This saved the application team from wasting their valuable time reviewing various access logs or manually debugging to locate the source of the delay. Analyzing the user-side delays is not possible with process logs or access logs. Observability solutions play a crucial role here.

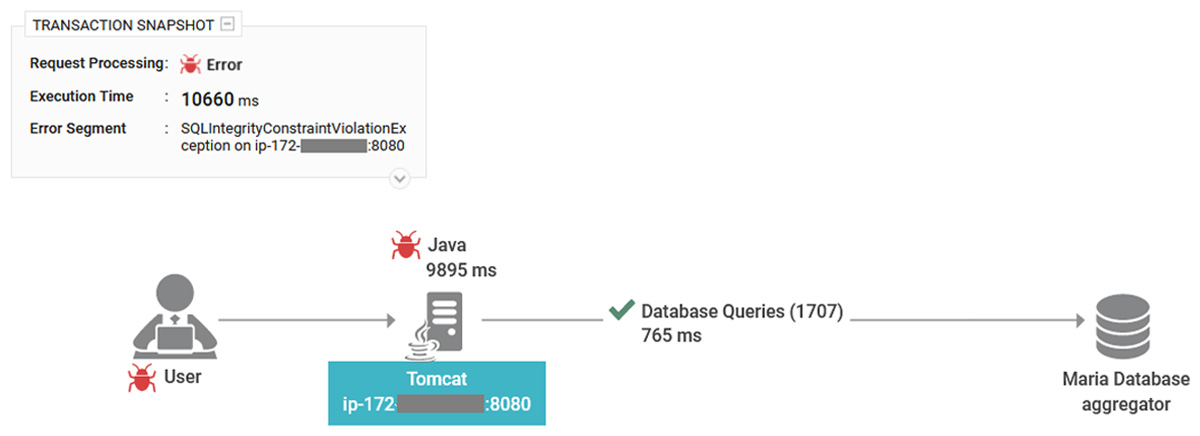
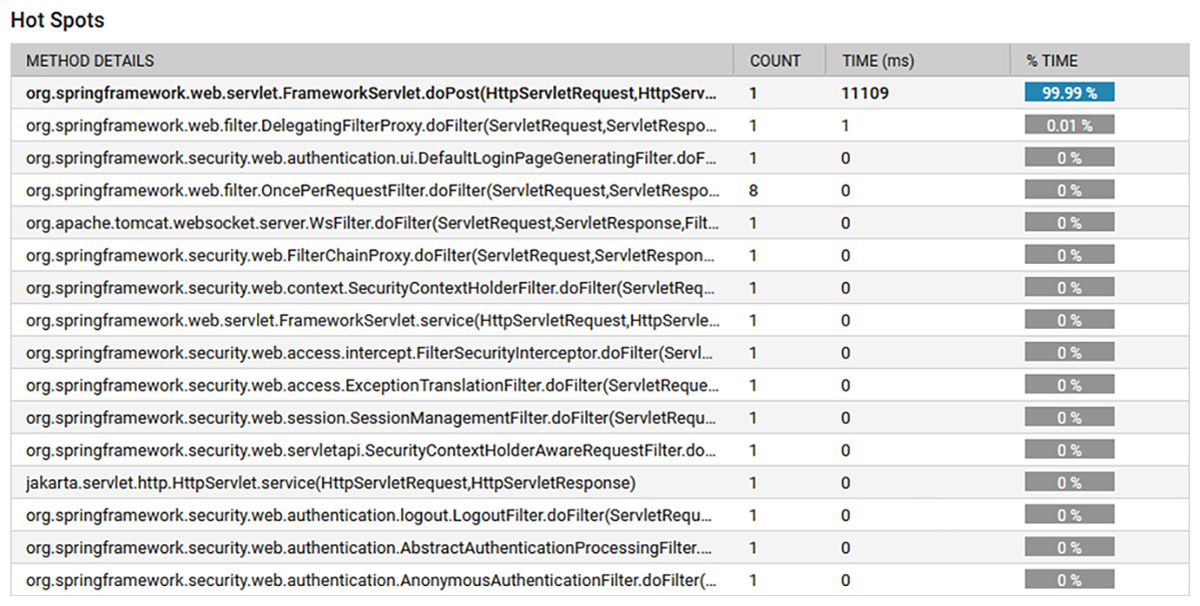
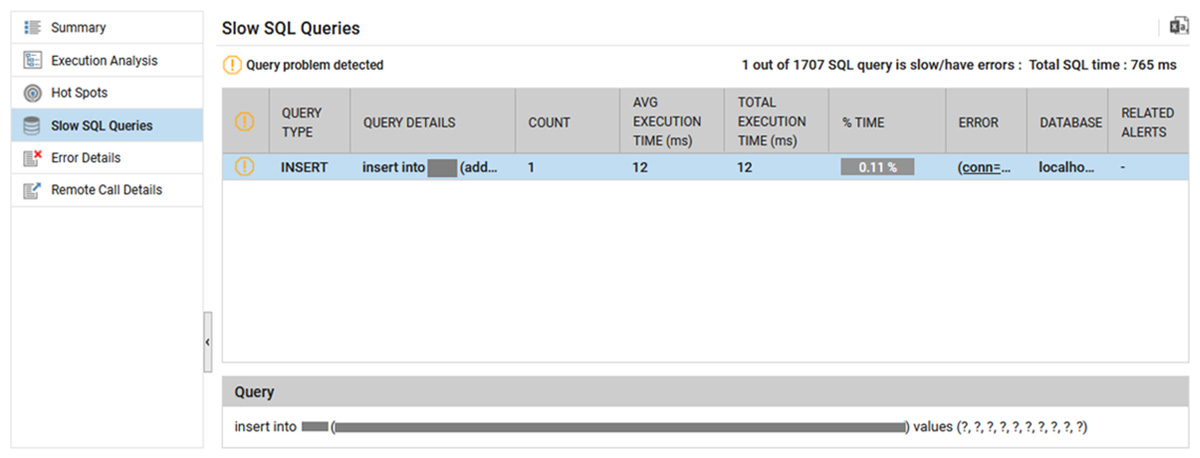
Another issue was discovered during the stress and load testing, whereby requests were delayed due to long execution times on the application server. The eG Enterprise Real User Monitor (RUM) provided the team with a single-click insight into the cross-application topology, allowing them to visualize how the slow requests were handled on the server side. It identified slow SQL queries and the specific Java method that caused the sluggishness. The application team was empowered with full visibility into each of the slow requests and their root cause.
Logs and Shift-left Monitoring
Finally, it is about the logs – It ranked second highest in terms of the number of alerts. Whenever faults were detected in the logs, a notification was sent to the application team, which was resolved overnight, and the application was republished without any issues.

Quantifying the Effectiveness of Shift-left Monitoring
The collaborative effort between the development team, operations team, and us resulted in successful outcomes in a shorter time and smooth production migration.

The reporting capabilities within eG Enterprise that tracked the incidents and issues through the testing phases were particularly useful for this client to demonstrate the progress of the migration project.
eG Enterprise is an Observability solution for Modern IT. Monitor digital workspaces,
web applications, SaaS services, cloud and containers from a single pane of glass.
Conclusion
The key takeaway from this story is that none of the issues had anything to do with the cloud computing platform. Rather, the problems stemmed from bottlenecks in the code caused by an unexpected surge in production data, reliance on external web calls, and a few bugs in the application code. Fortunately, these issues were addressed and effectively mitigated pre-production because of the shift-left monitoring strategy.
Whilst cloud provider monitoring is sufficient to identify capacity-related bottlenecks – it can tell you what happened, root-cause diagnostics and observability tools are needed to answer why. Cloud monitoring tools are primarily there to diagnose cloud platform issues.
Footnote: Some of the content of this article has been published in a generalized and wider context of cloud application migration and observability over on DZone, see: Mitigate the Risks of Poor Performing Cloud Apps – DZone.
eG Enterprise is an Observability solution for Modern IT. Monitor digital workspaces,
web applications, SaaS services, cloud and containers from a single pane of glass.
 Pandian Ramaiah is a Technical Consultant based in the eG Innovations’ Singapore office. He works with customers across the APAC region providing technical advice and solution architectures to implement modern observability across a wide range of technologies including APM, infrastructure and databases.