Identifying and Diagnosing a CPU Issue in the JVM
In this section, let us consider the case of the Java application, aws02_japp:7077, which is being monitored by eG Enterprise. Assume that this application is running on a Tomcat server.
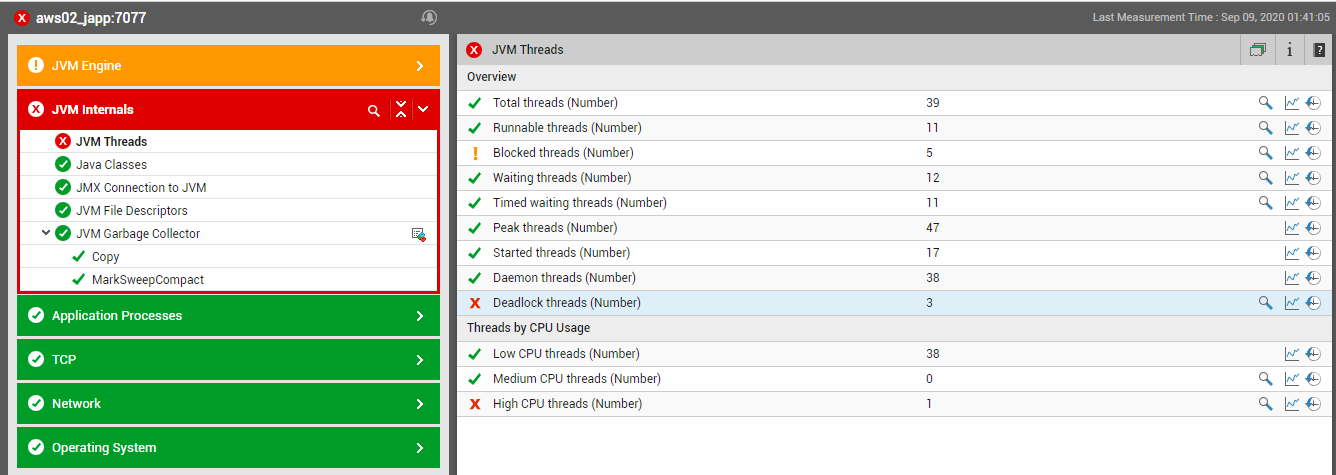
Figure 1 : The Java application being monitored functioning normally
Say, suddenly, one of the threads executed by the application starts to run abnormally, consuming excessive CPU resou
To know which thread is consuming too much CPU, click on the diagnosis icon (i.e., the magnifying glass icon) corresponding to the High CPU threads measure in Figure 1. Figure 2 then appears revealing the name of the CPU-intensive thread (SapBusinessConnectorThread) and the percentage of CPU used by the thread during the last measurement period. In addition, Figure 2 also reveals the number of times the thread was blocked, the total duration of the blocks, the number of times the thread was in waiting, and the percentage of time waited, thereby revealing how resource-intensive the thread has been during the last measurement period.
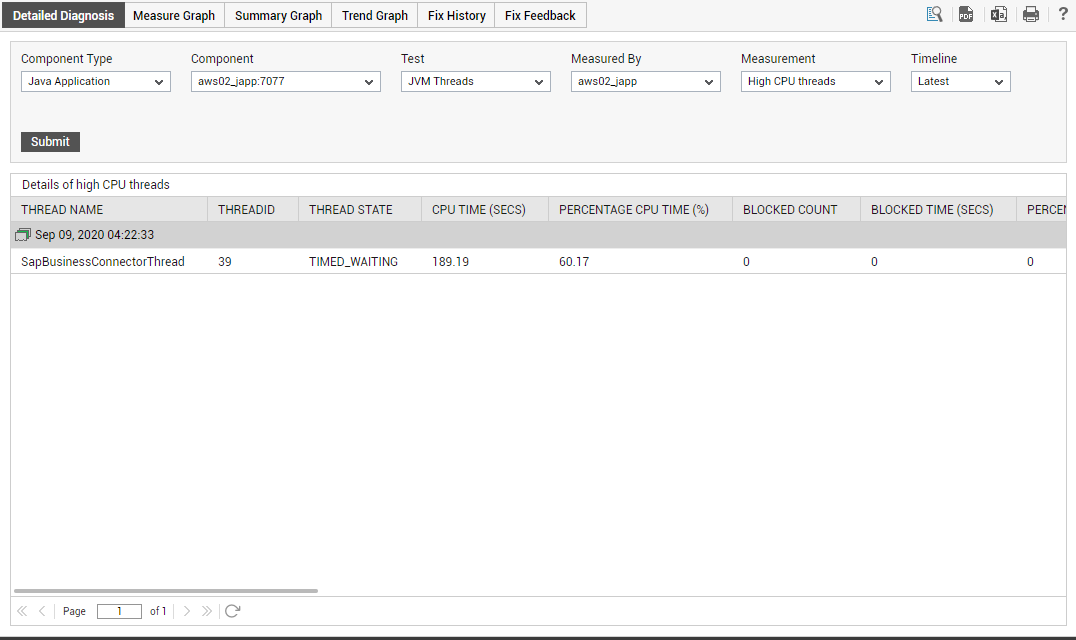
Figure 2 : The detailed diagnosis of the High CPU threads measure
Let us now get back to the CPU usage issue. Now that we know which thread is causing the CPU usage spike, we next need to determine what is causing this thread to erode the CPU resources. To facilitate this analysis, the detailed diagnosis page of Figure 2 also provides the Stack Trace for the thread. You might have to scroll left to view the complete Stack Trace of the thread (see Figure 3).
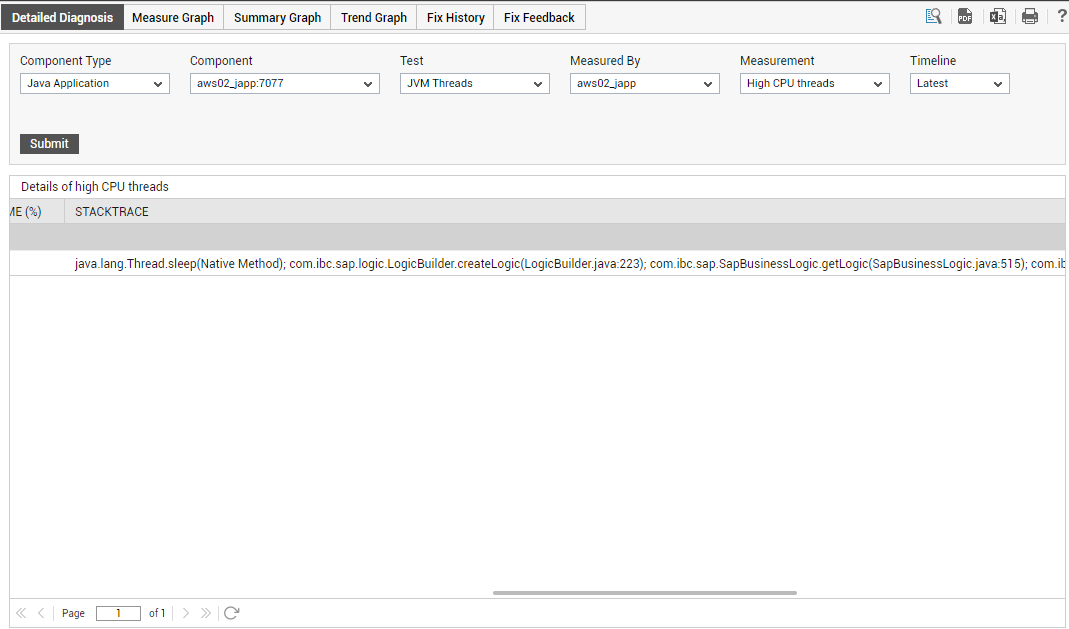
Figure 3 : Viewing the stack trace as part of the detailed diagnosis of the High cpu threads measure
The stack trace is useful in determining exactly which line of code the thread was executing when we took the last diagnosis snapshot and what was the code execution path that the thread had taken.
To view the stack trace of the CPU-intensive thread more clearly and to analyze it closely, click on the  icon in Figure 3.
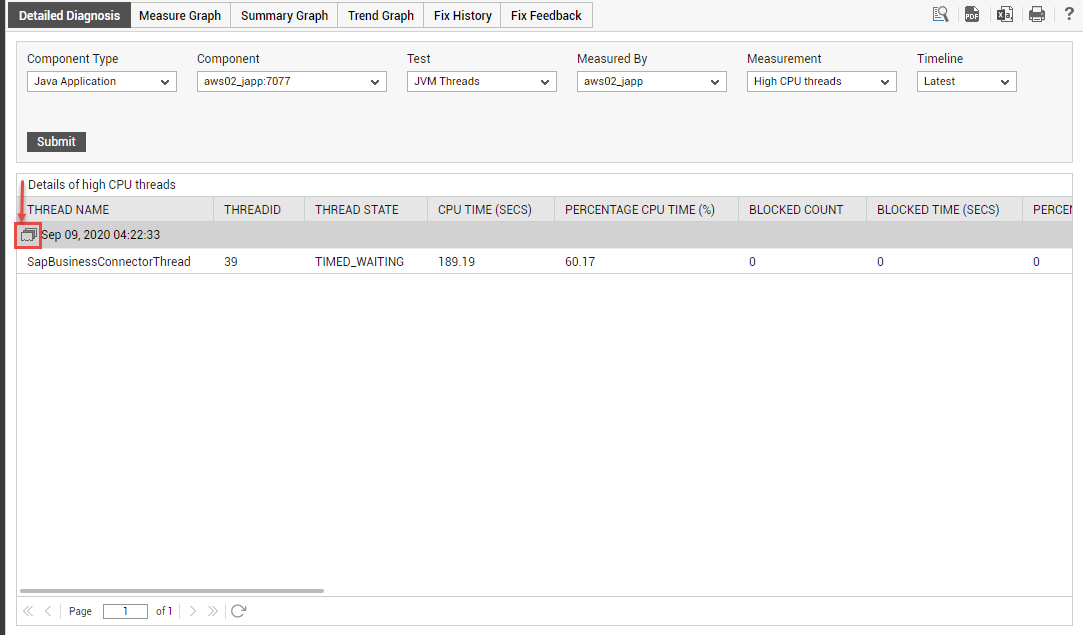
Figure 4 : The Stack Trace icon in the detailed diagnosis page
Figure 5 then appears.
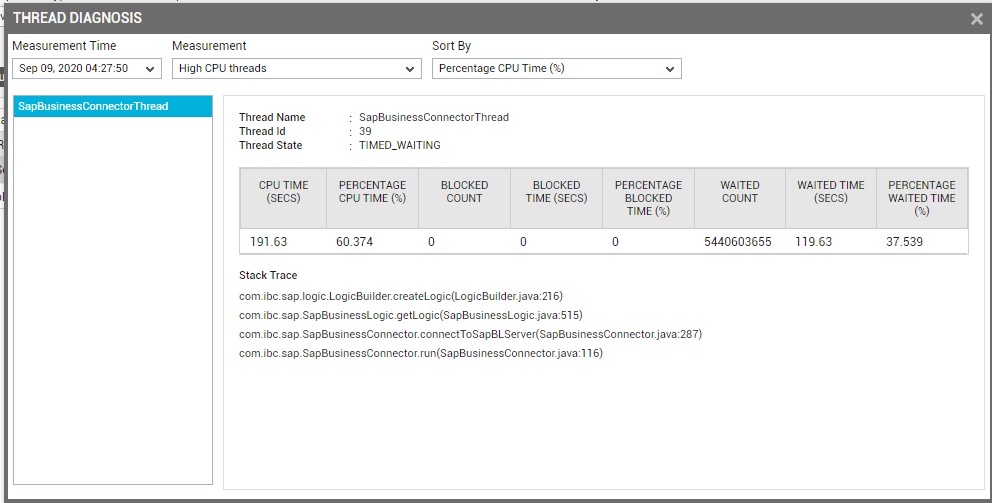
Figure 5 : Stack trace of the CPU-intensive thread
As you can see, Figure 5 provides two panels. The left panel of Figure 5, by default, displays all the high CPU-consuming threads sorted in the descending order of their CPU usage. Accordingly, the High CPU threads measure is chosen by default from the Measurement list, and the Percentage Cpu Time is the default selection in the Sort By list in Figure 5. These default selections can however be changed by picking a different option from the Measurement and Sort By lists.
The right panel on the other hand, typically displays the current state, overall resource usage, and the Stack Trace for the thread chosen from the left panel. By default however, the right panel provides the stack trace for the leading CPU consumer.
In the case of our example, since only a single thread is currently utilizing CPU excessively, the name of that thread (i.e, SapBusinessConnectorThread) alone will appear in the left panel of Figure 5. The right panel too therefore, will display the details of the SapBusinessConnectorThread only. Let us begin to analyze the Stack Trace of this thread carefully.
Stack trace information should always be viewed in a top-down manner. The method most likely to be the cause of the problem is the one on top. In the example of Figure 5, this is com.ibc.sap.logic.LogicBuilder.createLogic. The line of code that was executed last when the snapshot was taken is within the createLogic method of the com.ibc.sap.logic.LogicBuilder class. This is line number 216 of the LogicBuilder.java source file. The subsequent lines of the stack trace indicate the sequence of method calls that resulted in com.ibc.sap.logic.LogicBuilder.createLogic being invoked. In this example, com.ibc.sap.logic.LogicBuilder.createLogic has been invoked from the method com.ibc.sap.SapBusinessLogic.getLogic. This invocation has been done by line 515 of SapBusinessLogic.java source file.
To verify if the stack trace is correct in identifying the exact line of the source code that is responsible for the sudden increase in CPU consumption by the SapBusinessConnectorThread, let us review the LogicBuilder.java file in an editor (see Figure 6).
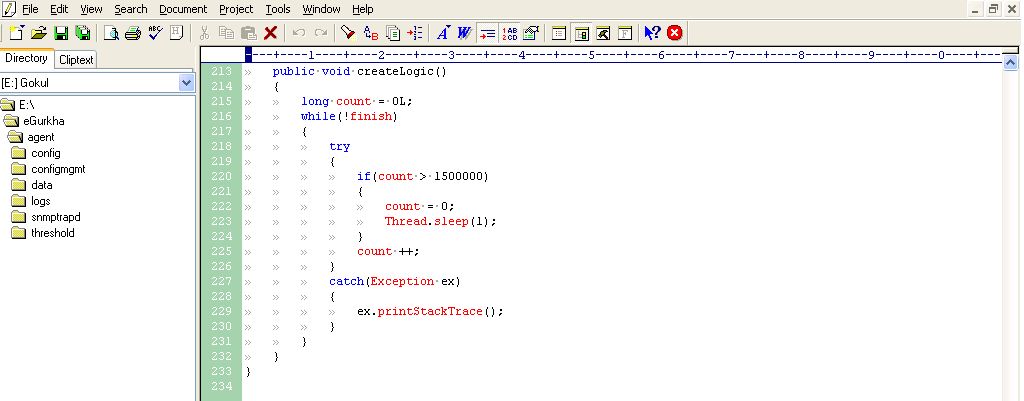
Figure 6 : The LogicBuilder.java file
Figure 6 indicates line 216 of the LogicBuilder.java file. At this line, a while loop seems to have been initiated. This code is supposed to loop 1,500,000 times and then sleep waiting for count to decrease. Instead, a problem in the code – the value of count being reset to 0 at line 222 - is causing the while loop to execute forever, thereby resulting in one of the threads in the JVM taking a lot of CPU. Deleting the code at line 222 would solve this problem. Once this is done, then the SapConnectorThread will no longer consume too much CPU; this in turn will decrement the value of the High Cpu threads measure by 1.
With that, we have seen how a simple sequence of steps bundled into the eG JVM Monitor, help an administrator in identifying not only a CPU-intensive thread, but also the exact line of code executed by that thread that could be triggering the spike in usage.